Benefits of Using These 3 Big Data Analytics Segments

Get helpful updates in your inbox
If you’re new to Ezoic or haven’t explored Big Data Analytics often, this toolset is here to help you achieve advanced and granular insights on your site. We are continuously adding and updating resources within the Ezoic dashboard and Big Data Analytics in order to help our customers have even more insight into the performance of their site, content, and more.
A large highlight in Big Data Analytics is real-time revenue tracking. Adding mobile segmentation, expanding the date ranges, and comparing the current period to last year’s period are a few of the filters commonly used that provide helpful insight.
Publishers have had tremendous success in adjusting their business based on data they’re finding in Big Data Analytics. We’ll walk through three segments of the platform you should be utilizing.
Brief overview
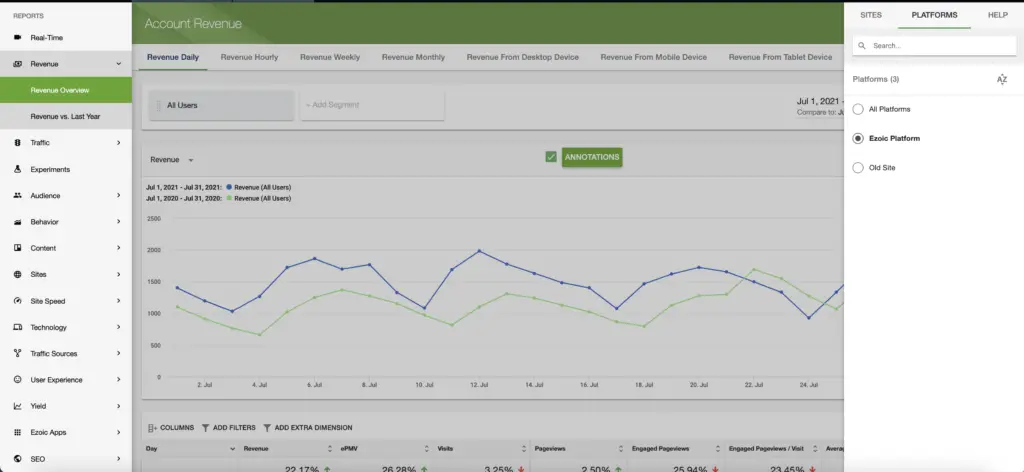
In the top right hand corner of the Big Data Analytics section, you can find all of your sites listed (if you have more than one site using the Ezoic platform). You can look at Big Data Analytics for one site or across more than one site, as well as ‘all sites’.
You can click ‘platforms’ which will allow you to choose whether you’d like to look at data from just your old site (pre-Ezoic), just the Ezoic platform, or both (i.e. ‘all platforms’). When looking at any data, please ensure you have selected the correct platform that you’re interested in!
Content
Categories
In the Content section you can look into the categories tab to see what topics on your site are generating the most money for you. Firstly, sorting by page RPM will show you the most valuable categories that are getting you the highest ad rates. If you’re searching for a way to increase your page RPM, focus on all the categories that earn above your average RPM that you see at the top. In this example, it’s $7.
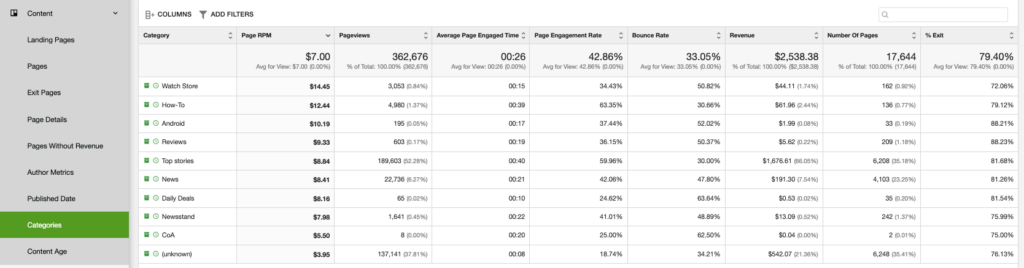
As an aside, Big Data Analytics will pull these categories from your WordPress. This means it’s up to you to make categories on your dashboard and publish your posts in them accordingly, otherwise, Big Data Analytics will have nothing to look at. This is one of the easiest, most underutilized segments of reporting.
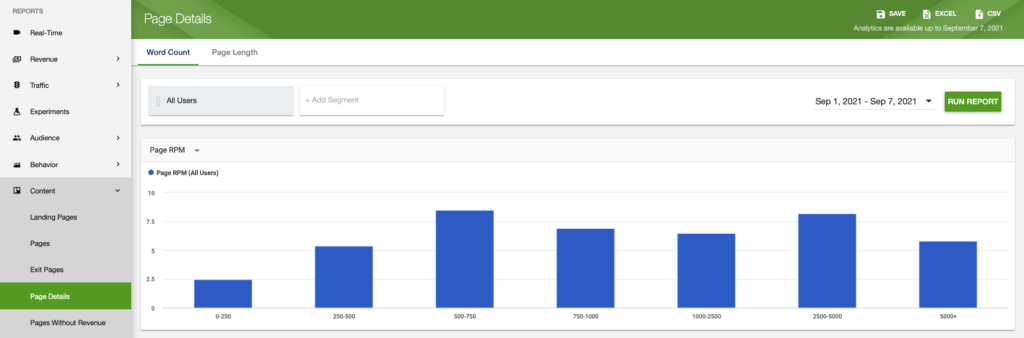
Page Details
Another facet inside of the content section is page details. Here you can see word count and page length. One of the most valuable pieces is looking at the word count and sorting by page RPM. From this report, you can deduce what length articles are generating the most money. This is usually something that looks different for every type of site.
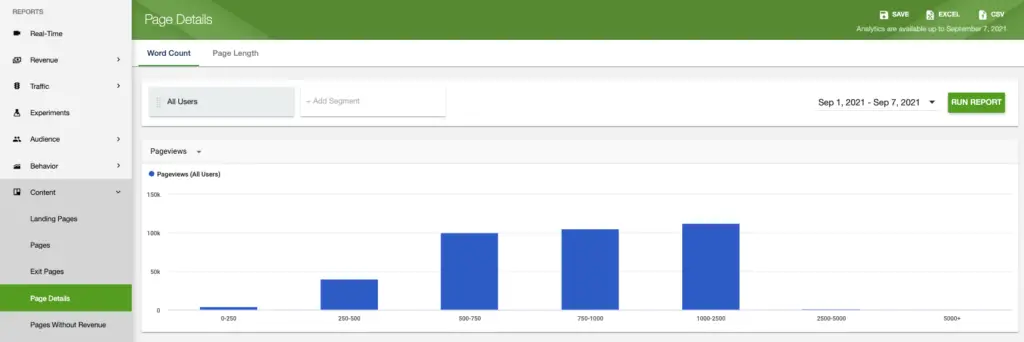
The next area to sort by is average page engaged time. This will tell you what length of articles users spend the most time engaging with. You may be surprised with what you find and make the conclusion that it’s not worth the ROI for your writers to write articles over 2,000 words because the page RPM is down, as well as the engagement time. In fact, shorter articles may have a longer engagement time in your niche.
Author Metrics
We’ve seen publishers build their entire model off of this report. They do this by paying their writers based on how they perform. In this report, sort by revenue. Next you can drag page RPM over and compare the two. Even though some authors may not generate as much traffic, they’re getting a higher revenue per page so you could say they’re more quality. From here you could generate questions and make decisions in regard to how your different authors are writing.
For example, giving tips and constructive criticism to people who get high traffic but lower RPM. Or having someone in particular start writing more because they have a super high RPM but not much traffic and not many posts published.
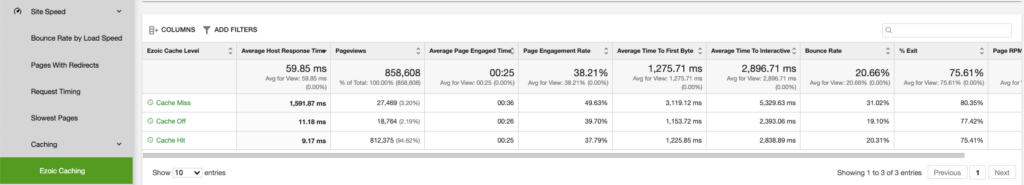
Caching
Inside of Site Speed, we’ll dive into the Caching tab and then Ezoic Caching. You can look at things like average host response time when cache hits, misses, or is turned off. When you get recommendations to reduce server response time, cache missed.So you can rerun the report or make sure to turn on caching. When caching is on we typically see sites cut their response time anywhere from 60 to 80 percent or beyond.
Ezoic cache is a near-instant response because we load it closest to the visitor as possible. If the cache misses or cache is off, a call needs to be made to the host, which can take exponentially longer.
Typical fixes for this are also to remove any caching plugins or caching settings at your host level – anything that’s trying to cache in front of Ezoic. Then enable Ezoic caching. Our plugin will automatically update and clear your cache accordingly.
Here’s a perfect example when referring to page experience for your visitors: pageviews, bounce rate, and page RPM. When the cache hits, you see an increase in page RPM and a reduction in bounce rate. That’s awesome.
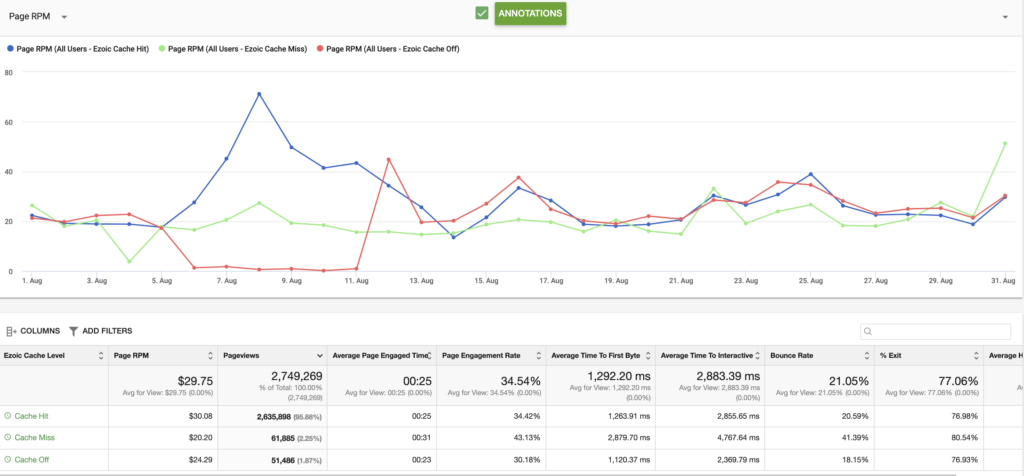
Ezoic caching makes you more money.
Yield
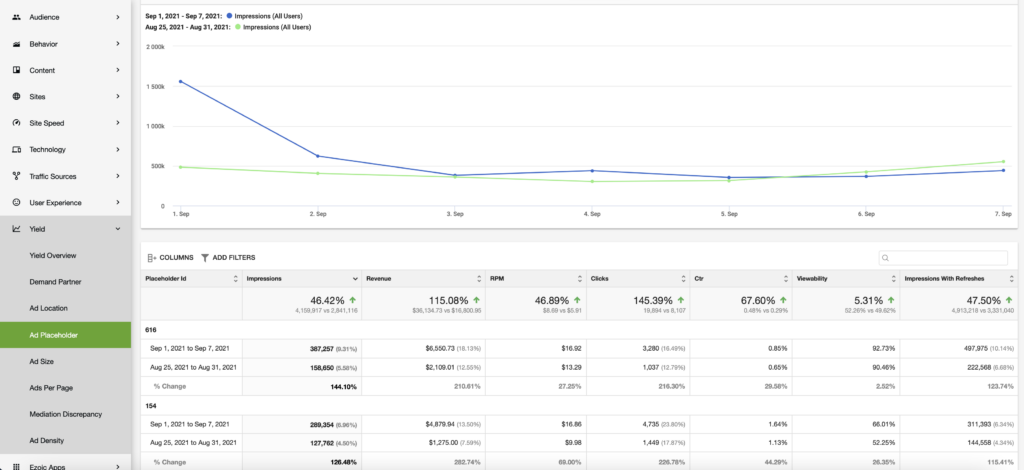
Ad by placeholder
A great spot to look for insights on your site is located within the “yield” section under “ad by placeholder”. You may have changed a plugin or widget on your website and now you’re earning less on a page or two. What you can do here is look at your placeholders and how much revenue they earn and then compare the current period to the point in time before you made the change to your site. By placeholder, you’ll be able to see which ones are increasing or decreasing.
Ads per page
In this report, a good starting point is to make a comparison period. For example, you can try looking at the last whole month and comparing it to the month before. More often than not as your tenure continues with Ezoic, you’ll find that we’re showing fewer ads impressions while having your revenue climb and you can find it here.
This publisher below was a perfect example.
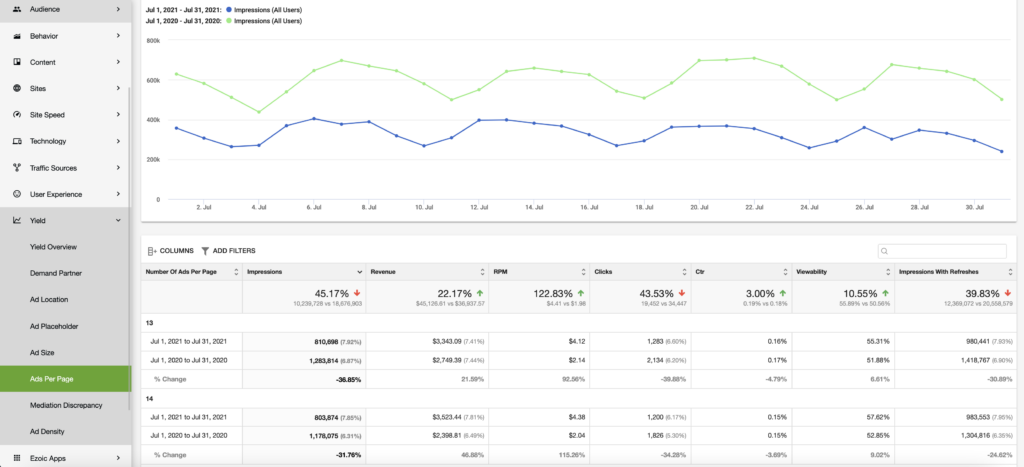
Most ad ops folks are the exact opposite, finding ways to jam more ads in over time. But with Ezoic, we’re helping drive your ad rate up instead of depleting it and using up the excess.
You can read more about how Ezoic earns you more money with fewer ads.
Wrap up
What we’ve learned is that using Big Data Analytics can be a part of your routine in looking at your Ezoic dashboard.
While there are many helpful reports within Big Data Analytics, you can look at the three segments here that can be your building blocks to scale your site’s growth.
Put everything together and make decisions based on the data. No one piece of a report is truly enough to make a change or conclusion about your website, its speed, or content.
Additionally, we have an Ezoic Academy playlist on YouTube that covers many how-to topics to learn more about Big Data Analytics features and reports.
Erik is a digital marketing and content creation expert. Erik has consulted and developed media for brands, earning accolades for his agile tactics and lean marketing approaches.
Featured Content
Checkout this popular and trending content

Ranking In Universal Search Results: Video Is The Secret
See how Flickify can become the ultimate SEO hack for sites missing out on rankings because of a lack of video.
Announcement
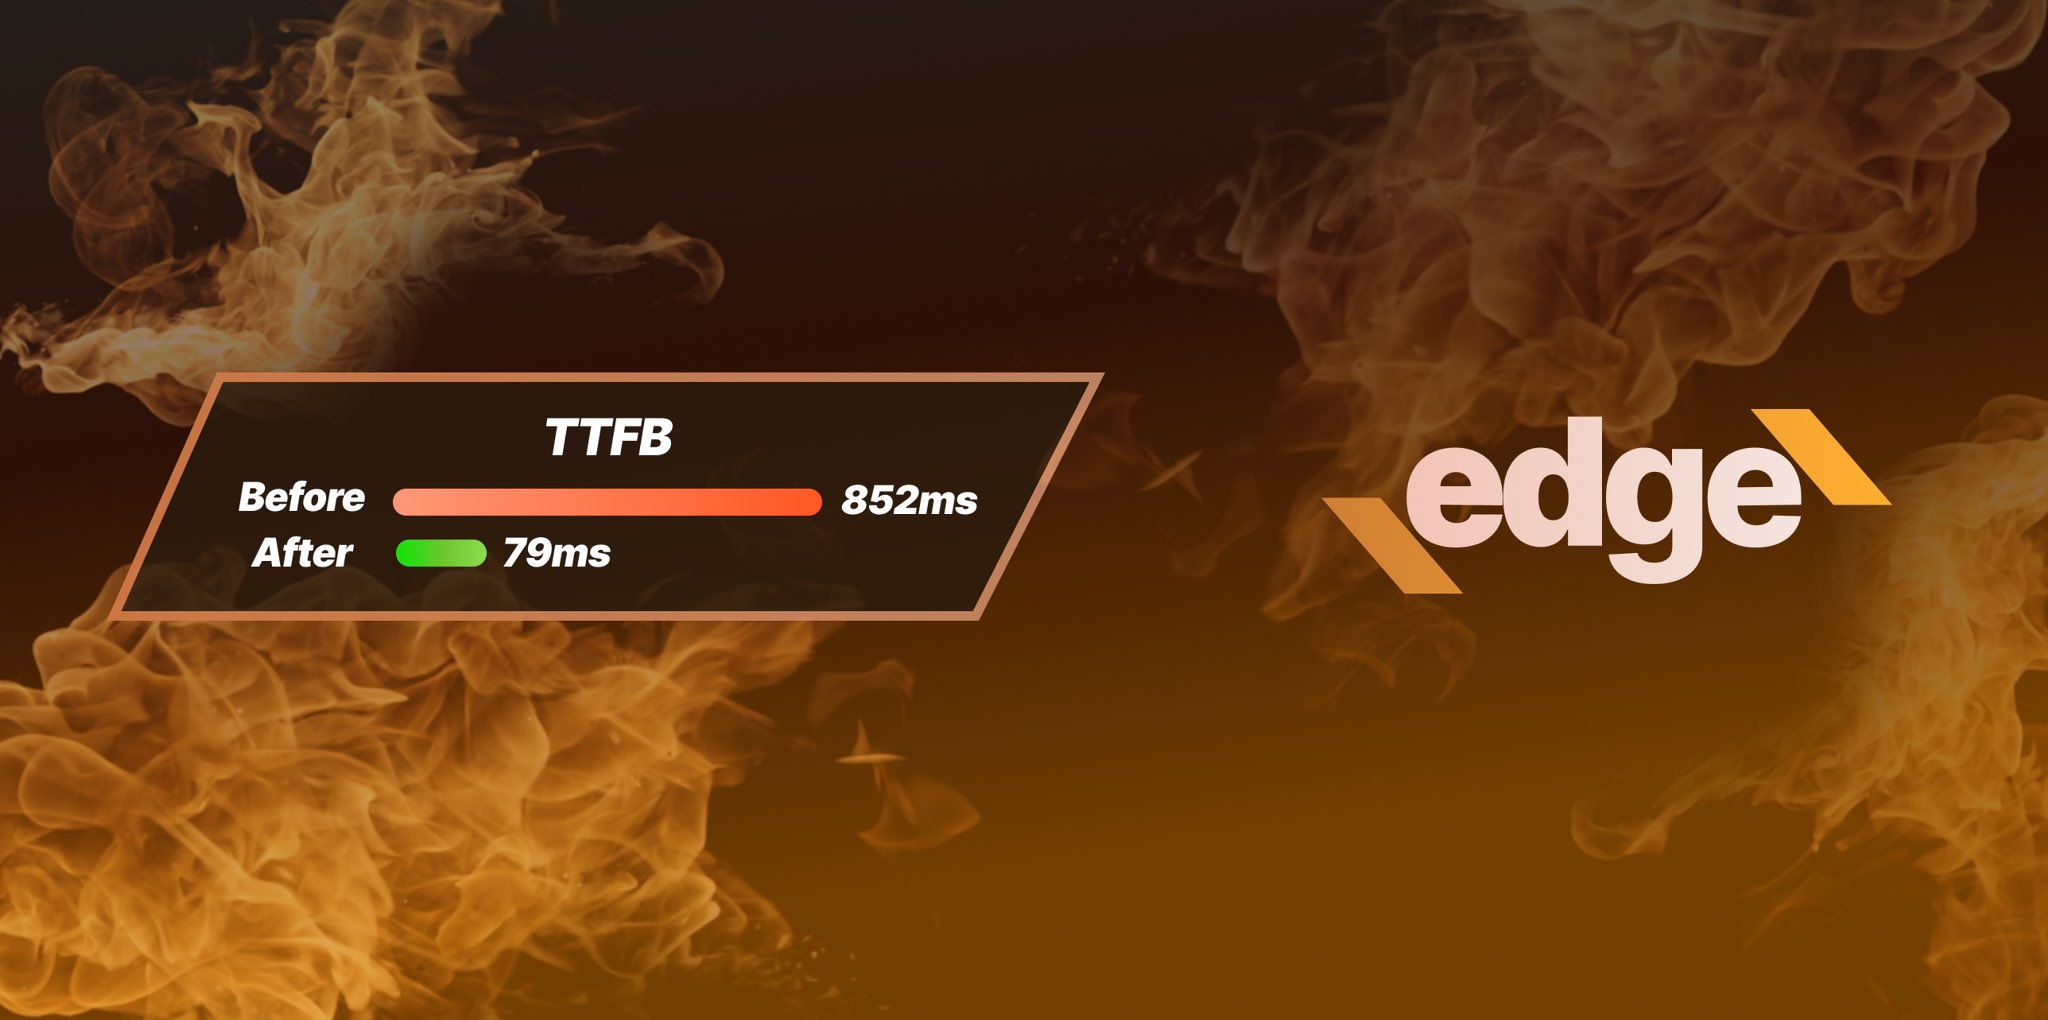
Ezoic Edge: The Fastest Way To Load Pages. Period.
Ezoic announces an industry-first edge content delivery network for websites and creators; bringing the fastest pages on the web to Ezoic publishers.
Launch
Ezoic Unveils New Enterprise Program: Empowering Creators to Scale and Succeed
Ezoic recently announced a higher level designed for publishers that have reached that ultimate stage of growth. See what it means for Ezoic users.
Announcement