Understanding Bounce Rate & Its Relation to User Experience

Get helpful updates in your inbox
 If you want to know how well your content is resonating with your intended audience, it’s a good idea to keep a close eye on your bounce rate. However, this number can sometimes be misleading if not viewed in the right context.
What may seem like a high bounce rate for one type of site might actually be a great bounce rate for another type. For instance, news sites and blogs typically have higher bounce rates than ecommerce sites. But, before we get into that, let’s take a step back and look at what bounce rate really means.
What Is Bounce Rate?
Google Analytics uses the following definition for bounce rate:
Bounce rate is the percentage of single-page sessions (i.e. sessions in which the person left your site from the entrance page without interacting with the page).
For the most part, this means that a “bounce” is any visit in which a user lands on a page on your site and then leaves without viewing any other pages. Since most of us want users to stay on our site and view as many pages as we can get them to read, a high bounce rate is a signal that shouldn’t be ignored.
Note that it is possible for a single-page session not to count as a bounce if the user interacts with that page in some other way that Google Analytics counts as an event and you’ve implemented event tracking on that page. If you’d like to know more event tracking, check out Google’s support page on events.
Measuring User Experience
The general idea behind using bounce rate as an indicator of user experience is the belief that the more pages someone views on your site during one session, the happier they are with your content.
In today’s world, though, this isn’t necessarily true – especially when we’re talking about news, education and information sites. Often, people visit these types of sites because they’re looking for a specific piece of information or are only interested in reading one particular story that was shared on social media. In these cases, finding everything they wanted on one page of your site could result in an excellent user experience despite the visit being technically counted as a bounce.
This leads us to the question:
Did users leave your site happy because they found what they were looking for or dissatisfied because they didn’t?
One way to investigate this issue is to look at bounce rate in combination with the average time spent on your site or an individual page on your site. When landing on a new page, typical users will scan that page first to see if it seems like it will be worth their time to read more closely. If the page doesn’t pass that initial scan test, they’ll usually leave your site fairly quickly.
So, if a page has a high bounce rate and users are leaving within a few seconds of arriving, there’s a decent chance that there is something they’re not liking about that page. On the other hand, if they’re staying on the page long enough to read it in more detail, there’s a better chance that they’re having a good experience even if they don’t go on to view other pages on the site.
In fact, this is the reason Ezoic uses a different way to calculate bounce rate than Google Analytics. Ezoic only counts a single-page visit as a bounce if a user leaves the page in less than 30 seconds. If someone stays on a page for longer than that, it’s generally because they found something worth sticking around for – and that’s a good indication of a positive experience.
What’s a Good Bounce Rate?
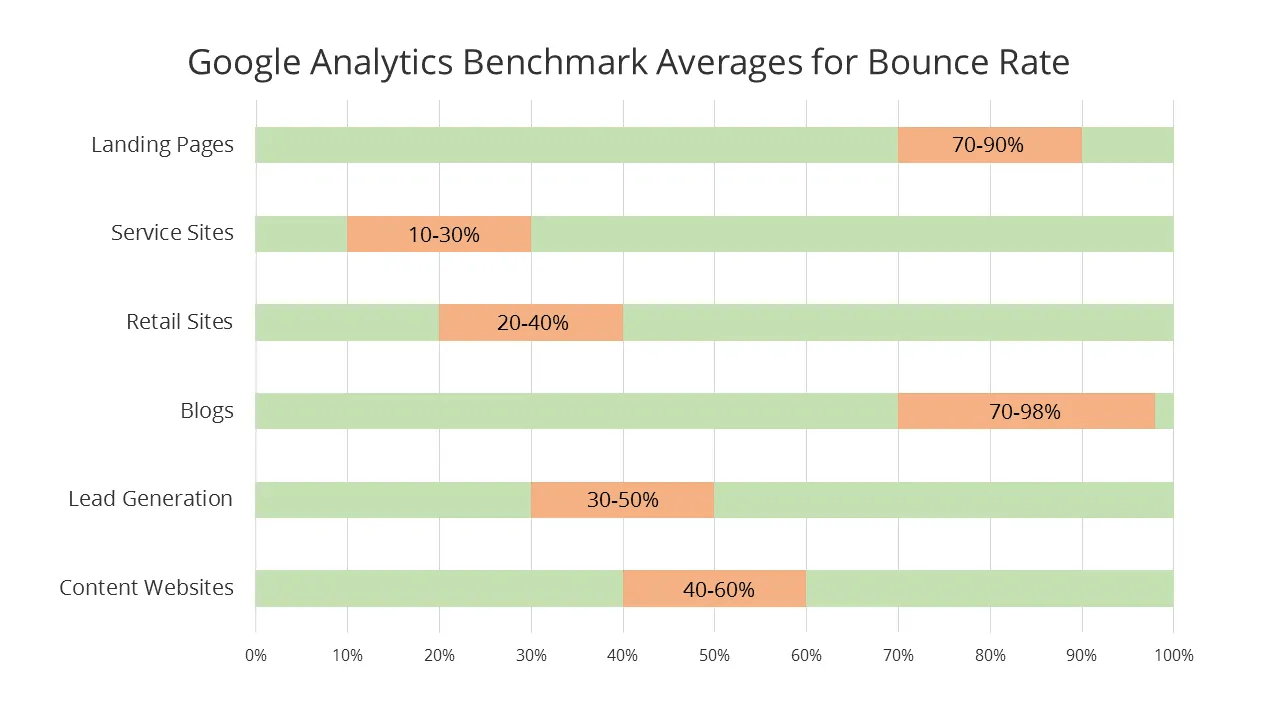
A couple of years ago, QuickSprout published an infographic which included benchmark averages for bounce rate for different types of sites. The following chart summarizes that information.

So, why is there such a big difference in bounce rate for different types of sites? A lot of it has to do with the user’s intent when visiting a site. For example, someone visiting a retail site is usually there to shop (or, at least, to “window shop”) and is probably going to read about and compare several products on the site, each of which is on a different page.
On the other side of the spectrum, blogs get a high percentage of their traffic via search engines and social media from users who are more narrowly focused. These users are far more likely to go to a site, read what they came to see, and then return to whatever they were doing without visiting another page on the site. But, as I mentioned earlier, that doesn’t mean they had a bad experience.
Benchmarking in Google Analytics
If you want an even better idea of how well you’re doing in terms of bounce rate, you can view benchmarking data in Google Analytics and compare your site to others like yours.
To do this, sign in to Google Analytics and make sure you have benchmarking enabled. If you’re not sure, don’t worry – you’ll be prompted to enable it when you try to view benchmarking data, and it only takes a couple of clicks. Then, go to the Reporting tab and look for Benchmarking in the left navigation bar (see screenshot below).

There are three different benchmarking reports you can view:
- Channels – View bounce rate and other metrics by traffic source
- Location – View by user location
- Devices – View by user device (desktop, tablet, mobile)
For all of these reports, you can select your industry vertical, the country in which your site is based, and the size of your site (measured by average daily sessions). Once you’ve chosen your parameters, you’ll see a message in the upper right corner of your screen telling you how many other sites are being used to compute the benchmark.
From here, you can compare your site to others in your benchmark group and may be able to catch problem areas right away. As an example, your overall bounce rate may appear high when compared to the benchmark. However, when you view the Devices report, you might see that you’re actually doing quite well on desktop but your mobile and tablet bounce rate are much higher than your industry average. This could indicate that your content is fine, but there is something about your mobile and tablet layouts that is driving users away.
Strategies for Improving Bounce Rate
So, what if you’ve reviewed your benchmark data and determined that your bounce rate isn’t so great when compared to other sites like yours? Here are a few things that you may want to consider.
1. Beware of title-content mismatches. Look at the bounce rates for individual pages of your site and see if there are a few that stand out as being higher than the others. For these pages, does the body of your content keep the promise that you made in the title? If not, consider editing the title, content or both so that you’re not misleading potential viewers.
2. Test the layout of your site – and keep testing. If the bounce rates are higher than you’d like them to be across your entire site and you feel pretty confident about your content, the locations of your ads or other layout factors may be creating a negative user experience.
In fact, if you show ads on your site, layout testing is never a bad idea. It could help you make a good bounce rate even better and significantly increase your ad revenue. It’s also a lot easier to do than most people think when you use tools like Ezoic’s automated Layout Tester.
3. Be sure your site is mobile friendly. Users may love your site on desktop, but cringe when they see it load on a tablet or smartphone. In addition to improving bounce rate and overall user experience, a mobile-friendly site may also help you rank better in search engines.
4. Utilize internal linking. Another way to encourage users to visit other pages on your site is to suggest other relevant articles or pages that might interest them. For instance, if you have other articles on your site on the same topic, let your readers know. You can do this by including links in the body of your content and/or including a Related Reading section at the end of your article.
If you’re a WordPress user, you may want to consider installing a Related Posts plugin. There are several out there to choose from, including one that comes bundled with Jetpack and the popular Yet Another Related Posts Plugin.
5. Utilize site search. If you don’t already offer some way for your users to search your site, you could be missing a lot of opportunities. After all, if there’s not an easy way to search on your site, chances are that they’ll pop back to Google or some other search engine to look for what they want. If that happens, it’s highly likely they’ll end up moving on to another site.
Although bounce rate can be a good indicator of how positive or negative an experience your site’s users are having, remember that a seemingly-high bounce rate isn’t always a bad thing. It’s all about context. Know how your site compares to others in your niche, and look for opportunities for improvement.

Tyler is an award-winning digital marketer, founder of Pubtelligence, CMO of Ezoic, SEO speaker, successful start-up founder, and well-known publishing industry personality.
Featured Content
Checkout this popular and trending content

Ranking In Universal Search Results: Video Is The Secret
See how Flickify can become the ultimate SEO hack for sites missing out on rankings because of a lack of video.
Announcement

Ezoic Edge: The Fastest Way To Load Pages. Period.
Ezoic announces an industry-first edge content delivery network for websites and creators; bringing the fastest pages on the web to Ezoic publishers.
Launch

Ezoic Unveils New Enterprise Program: Empowering Creators to Scale and Succeed
Ezoic recently announced a higher level designed for publishers that have reached that ultimate stage of growth. See what it means for Ezoic users.
Announcement
