
The Top Earning Website Categories In 2020

Get helpful updates in your inbox
It’s known in digital publishing that certain categories of websites are more valuable to advertisers. This is why serial site builders will build out sites in certain niches that pay higher ad rates. Both veteran publishers and those new in the space may wonder—what are the top earning website categories?
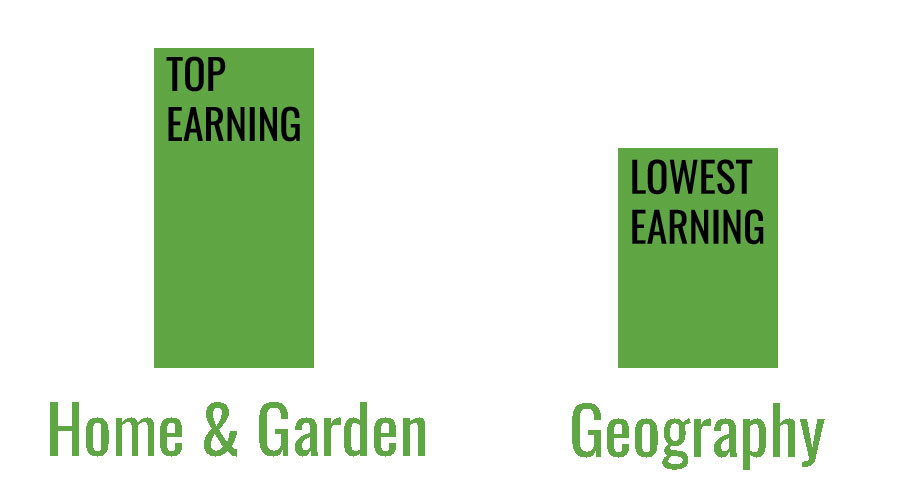
The data to help answer that question was pulled from thousands of sites across the web. We found the top earning website category was home and garden, and the lowest earning category was geography.
I’ll contextualize some of this data on the top earning website categories below
What are website categories?
Every site on the web falls into a category, with some sites belonging to more than one main category. This is because every site’s URL info carries some information when it is indexed by Google, Alexa Internet, and SimilarWeb.
Here is a free website category checker tool if you’d like to see your site’s category.
For more specific information, Amazon Web Services (AWS) has a developer guide on how to use the “Urlinfo” action to provide information about a website. The information returned is the same info that categorizes your site and provides traffic data to Alexa Web.
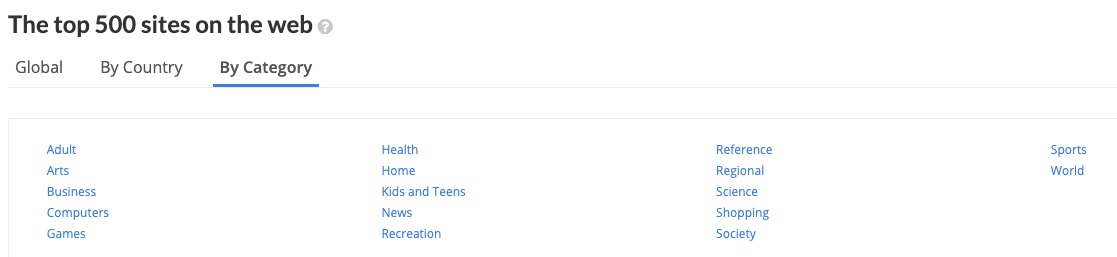
Note: The listings in the Top Sites by Category are ordered by popularity of this listing, and not by the overall Global rank of the site.
SimilarWeb also has the top sites within categories and better visualization of the sub-categories beneath them
What were the top earning website categories?
[table id=7 /]
We know that website categories affect ad revenue. This is because website categories affect ad rates, and subsequently, publisher revenues.
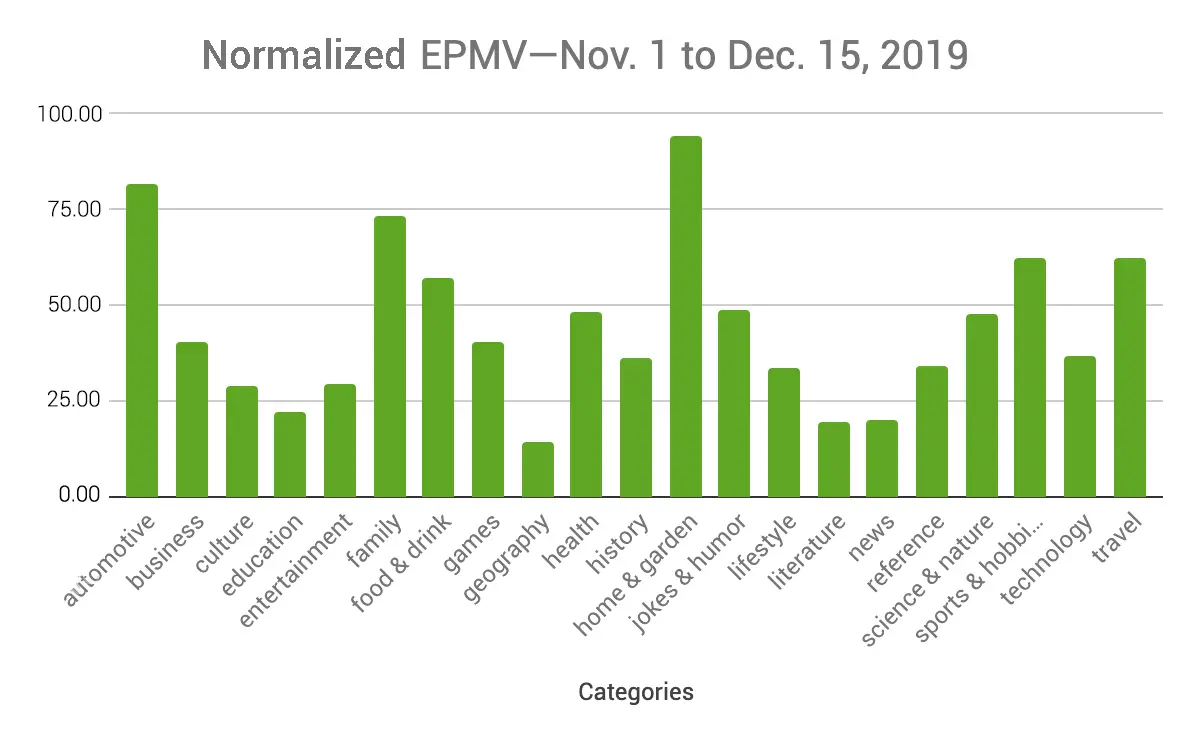
There are three categories from this data that stand out from the pack—automotive, family, and home & garden. The three lowest-averaged EPMVs were news, literature, and geography.
Why is this?
The answers have to do with how advertisers bid on the available ad inventory on your site. While there are a number of factors that affect the rates advertisers pay for a website visitor, in this instance, CPMs are higher on the sites where the ads for products or services are more valuable.
EX: You own a home and garden site with a large following. Of the available ad inventory on your site, Home Depot wins the bid for the most valuable ad spot. That spot is going to be far more valuable to Home Depot than a spot on news website. Plus, the types of things those advertisers are typically advertising are of higher value as well. A visitor that clicks on and purchases a new John Deere riding mower from an ad on a home and garden site is more valuable than a visitor purchasing Glossier lip gloss from an ad on a news website.
Besides news, literature and geography had the second-lowest EMPVs. Think about it. Will the types of products and services on those sites be of high value to the advertiser if a visitor makes a purchase?
Why is this category data important to publishers?
For the category data in relation to the normalized EPMV graph, it confirms what many in the industry already know. Audiences of certain categories of sites are more valuable to advertisers than others.
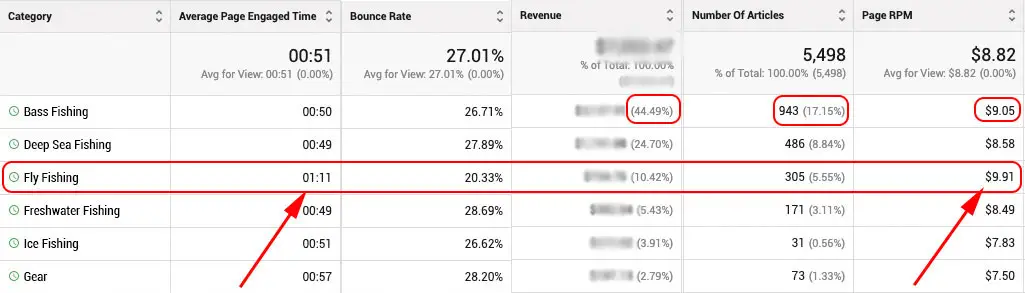
Publishers using Ezoic’s Big Data Analytics can get even deeper with content analytics that have the added benefit of being tied to revenue. A task that’s impossible to do with Google Analytics unless you pay $150,000 for Analytics 360. You can see the performance of content by category, author, and article length. This type of data can help inform your content strategy and overall growth of your site.
Wrapping up the top earning website categories
Does this data mean you have to abandon your site and jump ship? No, not at all. In contrast, this data is meant to serve as a reference to see where your own site might stand.
What’s important to remember is that regardless of site category, you can implement strategies on your site to engage your visitors to grow your audience. Here are some great blog resources to help launch your passion project or build on the growth of an existing site:
- 2 Content Growth Hacks That Drive More Website Traffic
- How To Launch And Grow A New Niche Website Quickly
- How To Become A Video Publisher & Grow Your Website
- 8 Steps to Building a Site That Makes Over $1,000 a Month
- Google Webmaster Guidance On Building High-Quality Sites
Do you have any questions on the data in this article? Let me know in the comments.
Allen is a published author and accomplished digital marketer. The author of two separate novels, Allen is a developing marketer with a deep understanding of the online publishing landscape. Allen currently serves as Ezoic's head of content and works directly with publishers and industry partners to bring emerging news and stories to Ezoic publishers.
Featured Content
Checkout this popular and trending content

Ranking In Universal Search Results: Video Is The Secret
See how Flickify can become the ultimate SEO hack for sites missing out on rankings because of a lack of video.
Announcement

Ezoic Edge: The Fastest Way To Load Pages. Period.
Ezoic announces an industry-first edge content delivery network for websites and creators; bringing the fastest pages on the web to Ezoic publishers.
Launch
Ezoic Unveils New Enterprise Program: Empowering Creators to Scale and Succeed
Ezoic recently announced a higher level designed for publishers that have reached that ultimate stage of growth. See what it means for Ezoic users.
Announcement