
Does Time To Interactive (TTI) Impact Website Revenue & Performance?

Get helpful updates in your inbox
Is Time To Interactive (TTI) Impacting Website Revenue & Performance?
One of the emerging website metrics that publishers are beginning to pay close attention to is Time to Interactive (TTI). It’s a website speed measurement that has gained fast popularity through its inclusion atop Google’s latest Pagespeed Insights reports. The metric itself looks at the time it takes for web content to become interactive and viewable for visitors.
TTI has become a staple of pagespeed optimization and is often touted by Google and others as one of the most important metrics for websites to observe when working on site speed and performance.
With the entire web obsessing about speed, we thought it might be a good idea to take a look at how TTI correlates with other important metrics for publishers.
The study below includes correlations between TTI and other metrics for over 1,000 different kinds of web publishers.
What is Time To Interactive (TTI)?
Time to interactive is a metric that calculates the length of time it takes for a website to become viewable and interactive to the visitor. TTI provides a more granular understanding of the time it takes until a website visitor is able to access the information they likely want and need from a page.
TTI is often looked at as a better metric for visitor experiences than metrics like page load time, time to first byte (TTFB), or time to response end. This is why it has been adopted by many of the large platforms and web advocates as a core speed metric to optimize around.
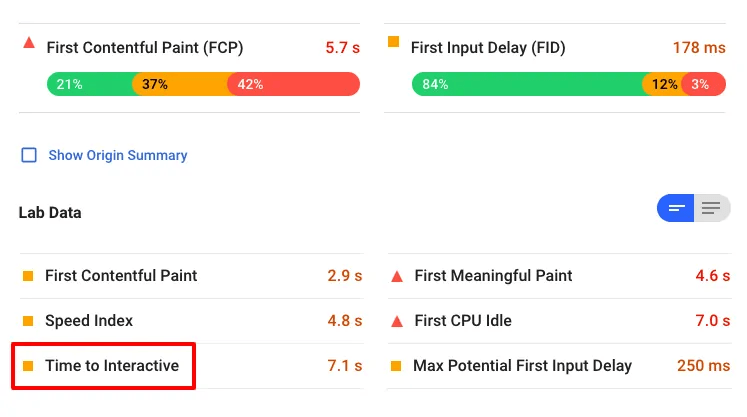
TTI is often considered the “2nd site speed metric”. First Contentful Paint (FCP) is referred to as the 1st, as it describes the first time any major element of the page or content loads visibility to the visitor. TTI is largely reflective of when that content becomes readable and actionable to the visitor.
TTI is seen as superior to FCP for understanding visitor experiences because it is more reflective of when a visitor can extract what is needed from the page. Often, FCP doesn’t represent a moment at which a visitor can begin reading or interacting with the content so the experience isn’t as optimal until the content becomes interactive.
How does TTI correlate with revenue and visitor experiences?
We looked at approximately 1,500 sites for the month of March in 2019 to review how TTI might be correlated with things like bounce rates, pageviews per visit, session duration, and website ad earnings.
We found that the avg. TTI does have a correlation to some of the objective visitor experience metrics, like bounce rate, but did not find a significant correlation between TTI and website ad earnings overall.
Additionally, we looked at how TTI compared to other site speed metrics to see if it was predictive of overall speed to the visitor vs. common metrics like average page load time.
We did not find a significant correlation to suggest that avg. page load time has the same effect on visitor experiences or website revenue to the same degree that we saw TTI have on these important metrics for publishers.
We adjusted for outliers in each of the charts below and feel that we have strong statistical confidence among the types of website represented to provide an objective perspective on these topics.
How does TTI affect page RPM?
We looked at Page RPM instead of EPMV because of the potential impact that TTI could have on the users time on page or their propensity to bounce. Since we’ve seen both of these metrics influence overall page revenue, we were interested to see if initial page revenue was affected by TTI.
It is important to note that Page RPM is not a good metric for measuring revenue or ad earning performance. As stated above, we are simply looking at how it could potentially be impacted by page load — therefor potentially impacting overall session earnings (EPMV), which a much better indicator of website earnings performance.
TTI does not have a very strong correlation with page RPM.
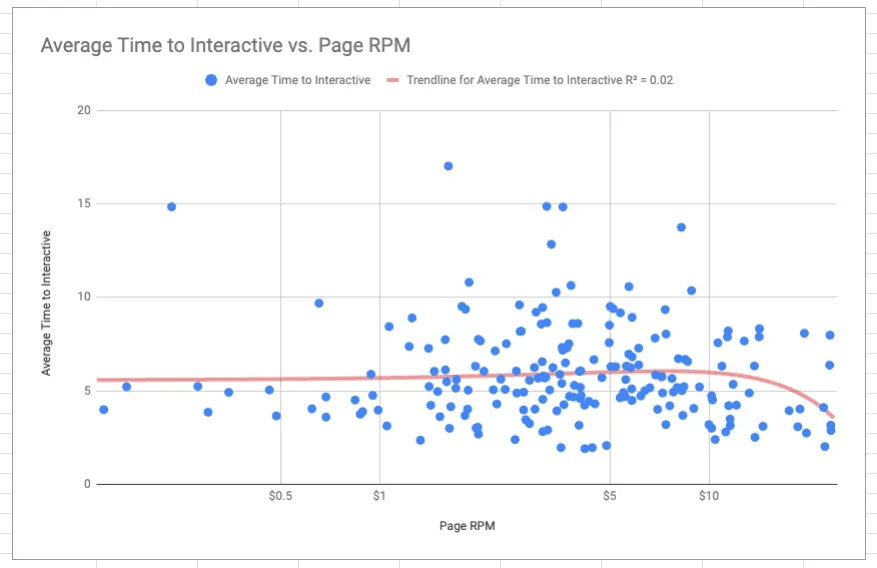
After accounting for outliers, it does not appear that TTI is a great predictor of Page RPM. While Page RPM does appear to spike just slightly for sites with TTI below 2.5s.
Most sites with a TTI below 10s experience approximately the same opportunity for an above-average page RPM.
Does TTI correlate with website bounce rates?
Yes. We found that there was a slight correlation between TTI and website bounce rates, although it was not as high for these publishers as it is often touted across all website (including non-publishers) according to Google’s own research.
In our dataset, we measure bounce rate differently than the default setting in Google Analytics. We measured a bounce as a single pageview that lasted LESS THAN 30 SECONDS. This is a more accurate and granular way of understanding visitor intent; especially for informational publishers or publishers that rely on Google Search for the majority of their traffic.
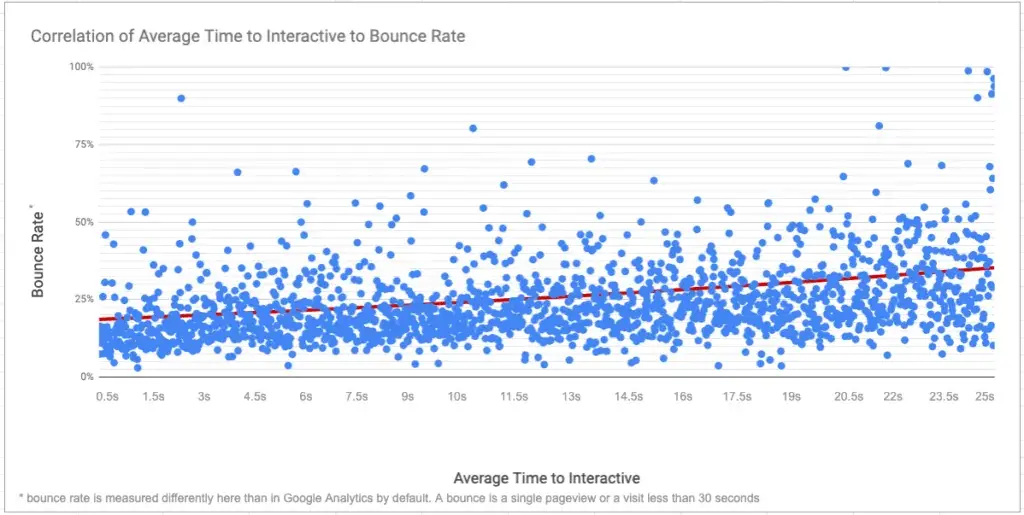
There is a gradual trend we see in bounce rate increases and how they correlate with longer TTI measurements. What is a bit surprising is that there was only about a 45% increase in average bounce rates between the sites with the lowest avg. time to interactive and the sites with the highest avg. time to interactive measurements.
Does time to interactive impact time on page?
We already know that TTI does have an impact on bounce rates (single pageviews less than 30 seconds). This means there will be a somewhat obvious correlation between TTI and the amount of time a visitor spends on their initial pageview.
The correlation is actually very slight. You can see the average pageview duration declining just slightly in the trendline as the avg. site TTI climbs.
It is very important to note that most of the outliers that exceed the average pageview duration times have a TTI of at least 10 seconds. In fact, all sites with an average pageview duration over 8 minutes saw a TTI less than 8 seconds. Average pageview duration didn’t really start to trend downward for the majority of publishers until TTI reached beyond 7.9 seconds.
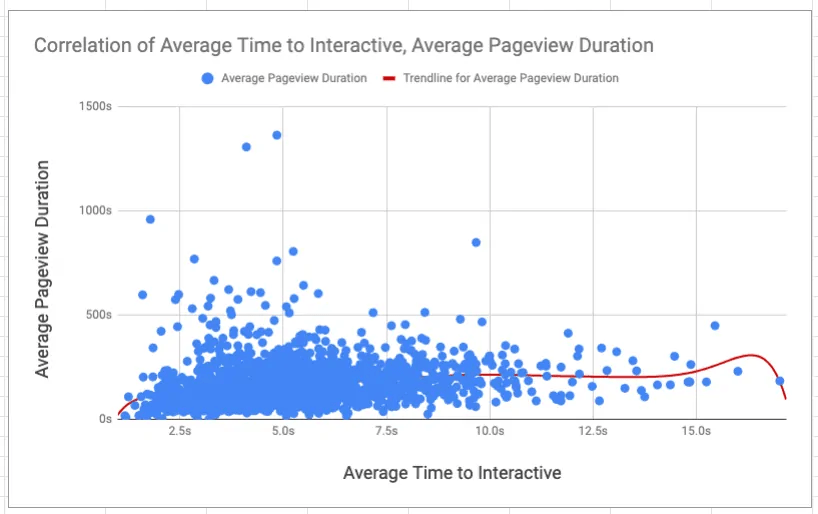
It seems most publishers have sites with a TTI that is low enough to prevent them from experiencing a major decline in pageview duration.
If there is one piece of advice for publishers seeking to maximize time on page (which is correlated with better ad rates in many cases), we recommend getting TTI below 10s if possible.
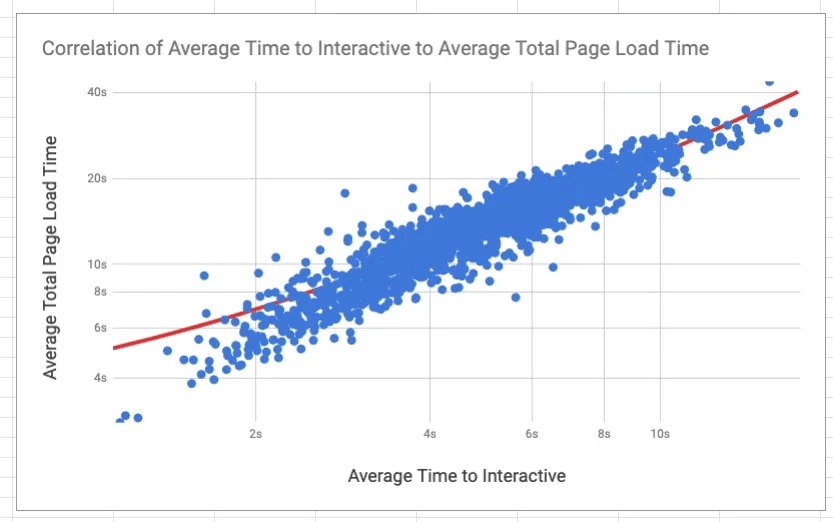
Average TTI and its correlation to total page load time
Not surprisingly, the greatest correlation we found in looking at how TTI impacts website earnings, user experiences, and speed measurements were the correlation between TTI and total page load time. It’s a bit intuitive that if a site takes longer to initially load the content that the total time to load the page would be greater as well.
Total page load time is the point at which a page — including all scripts, ads, and assets — are fully-loaded by the visitor’s browser.
Does Total Page Load time affect Page RPM?
We found that total page load time had no significant correlation to objective visitor experiences or website ad revenue beyond the correlation we see between TTI and total page load time.
Not surprisingly, TTI is a better predictor of how revenue is impacted by pagespeed. TTI is what will be most likely to impact a visitor’s physical ability to access and engage with the content. A visitor’s engagement is what advertisers are seeking when placing ads on a page. That’s why we strong improvements in total session earnings (EPMV) when publishers increase engagement time on their website.
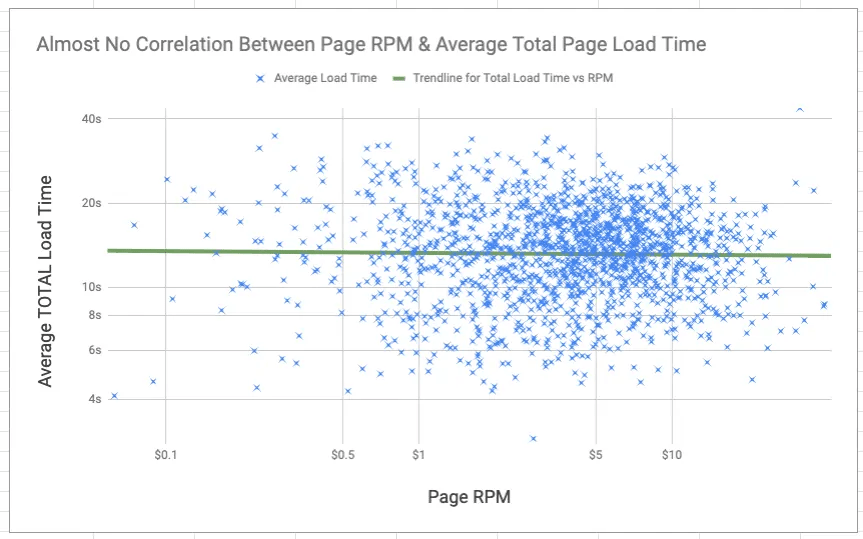
The takeaway in reviewing this particular data is that if a publisher wants to focus on site speed as a means of improving visitor experiences and website revenue, they should focus their attention on improving TTI over total page load time or TTFB (which had the poorest correlation to revenue and bounce rates).
What is a good Time To Interactive (TTI)?
Often, it is easy to simplify questions by asking what a “good” web metric is. While the act of comparison can be a helpful way of benchmarking aspects of your web property, it is important to remember that all sites are different. A better way of saying this might be that all audiences are different.
As we see above, bounce rates, page RPMs, and other metrics influence a lot of sites in different ways. TTI is not a metric that we can easily establish an optimal number for.
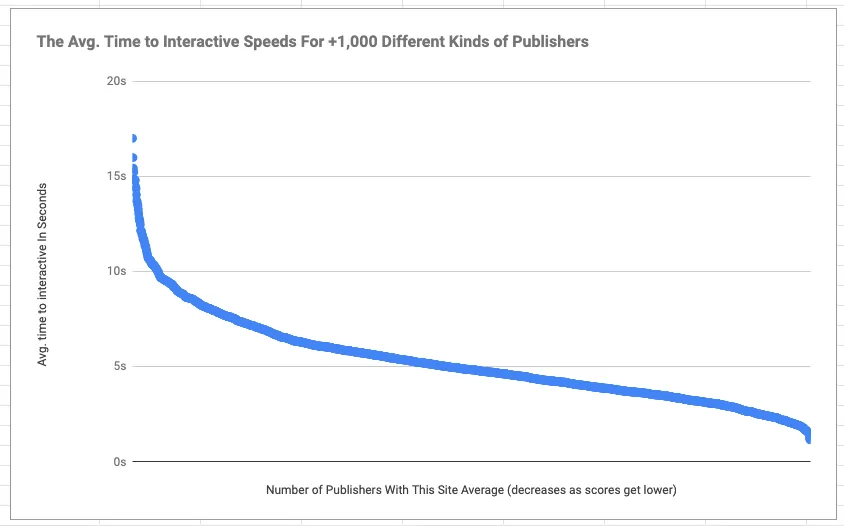
The average TTI of the +1,000 publishers in our dataset above was 5.2s. This included a wide mix of different publishers. This includes data from major brands, bloggers, and even informational sites with audiences that have limited access to a fast internet connection. An acceptable or optimal TTI will differ for each of them.
For the brand publishers and bloggers with audiences primarily located in countries with fast internet connections, we saw the average TTI be lower than the overall average.
If optimizing for bounce rates, Page RPM, or even pageview duration, we actually saw the threshold for non-optimal TTI scores be much higher than someone might normally predict.
In most cases, bounce rates, page RPMs, and time on page were not statistically impacted in a negative way unless average TTI was above 10s for most sites.
If a publisher is looking at what they can do with this information, the key takeaway might be to try to optimize TTI so that it is below 10s on average.
How do I get a lower TTI (time to interactive) on my website?
Hosting and server response time will play a role in all of this. It is worth monitoring your average server response time and understanding how your host could be influencing TTI. More importantly, implementing a CDN (content delivery network), like Cloudflare, can go along ways towards improving TTI as well.
(For Ezoic Users: Ezoic offers a free CDN through the caching app in the app store)
Lastly, optimizing the images, CSS, and Javascript on your site can help to improve TTI. In many cases, lazy-loading images, optimizing CSS and serving images in next-gen formats can cut TTI in half.
Additional resources for improving TTI:
Final thoughts:
TTI is probably worth improving and optimizing, especially if your site has a TTI over 10s (generally speaking of course). Compared to many other site speed metrics for publishers, TTI offers one of the most relevant correlations to better revenue and improved visitor experiences.
Thoughts or questions about TTI? Leave them below.
Tyler is an award-winning digital marketer, founder of Pubtelligence, CMO of Ezoic, SEO speaker, successful start-up founder, and well-known publishing industry personality.
Featured Content
Checkout this popular and trending content

Ranking In Universal Search Results: Video Is The Secret
See how Flickify can become the ultimate SEO hack for sites missing out on rankings because of a lack of video.
Announcement
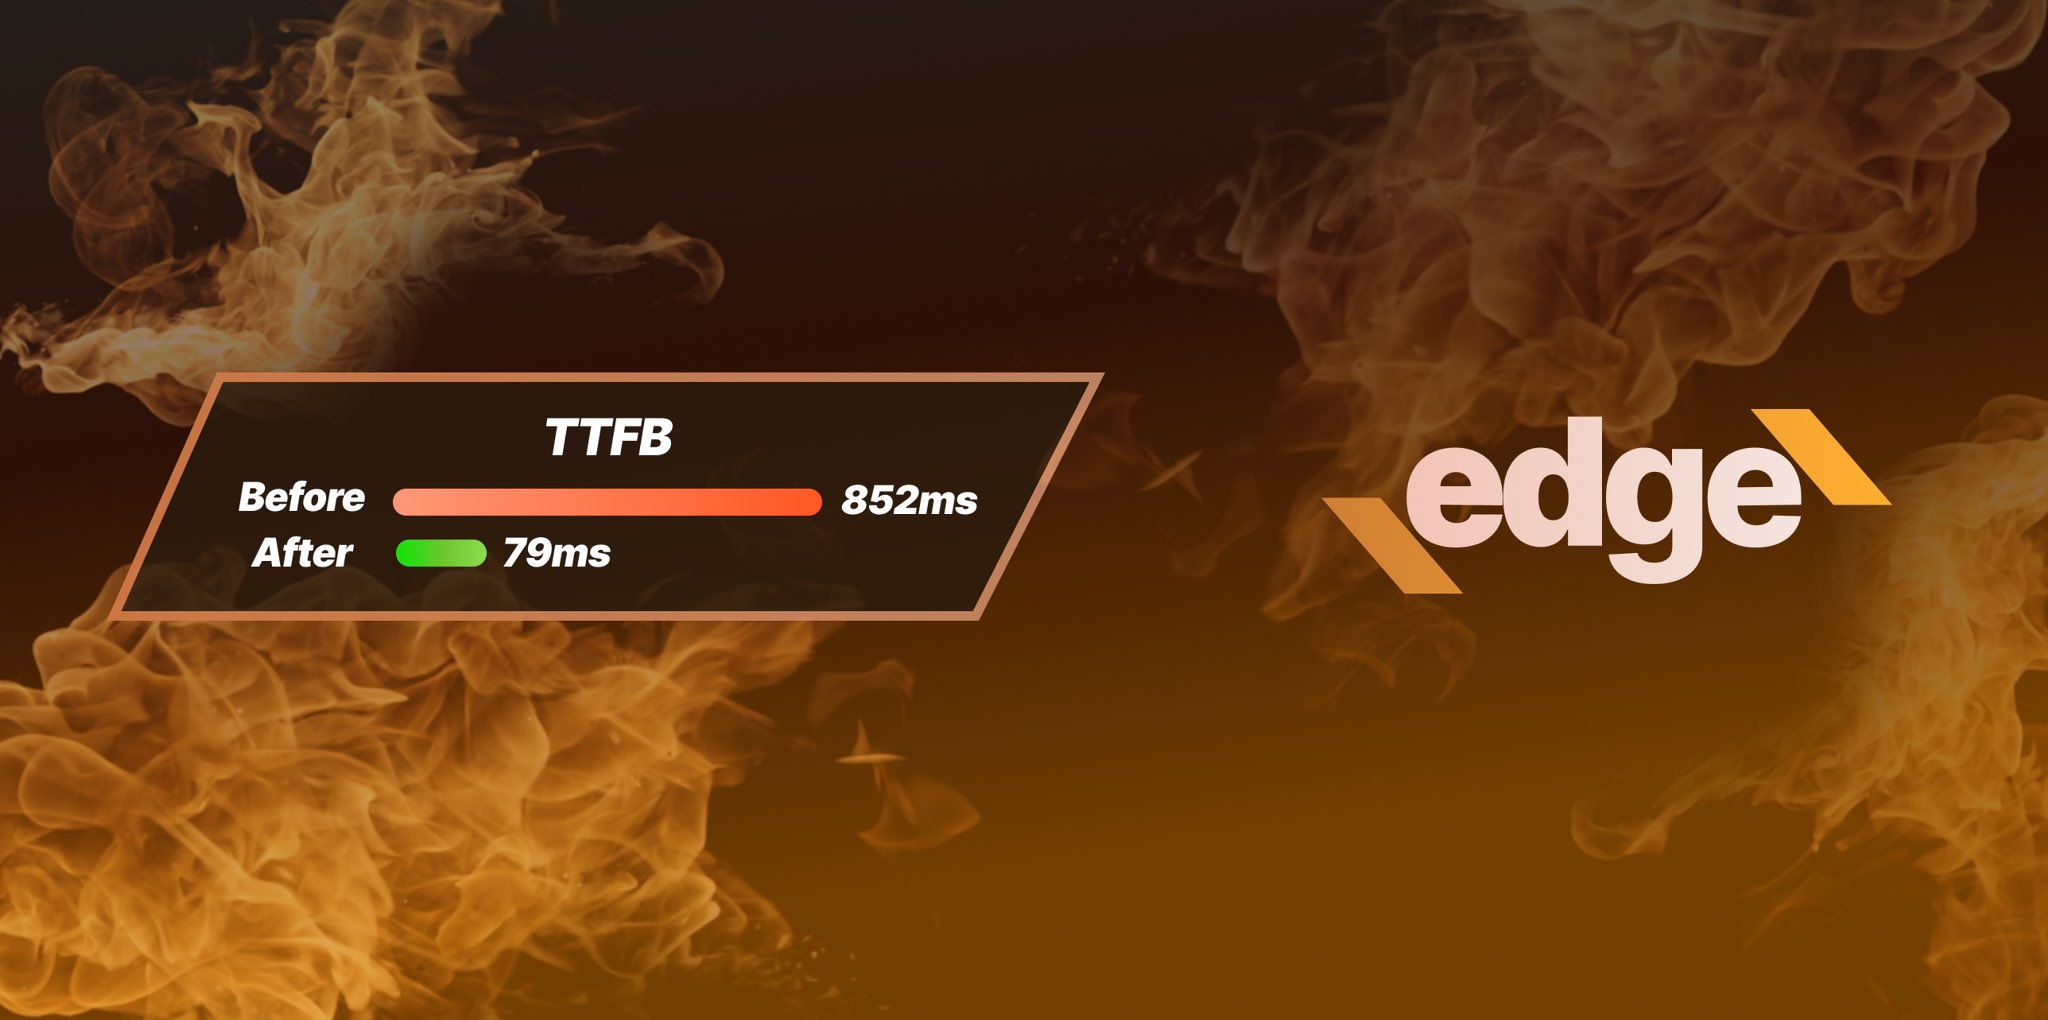
Ezoic Edge: The Fastest Way To Load Pages. Period.
Ezoic announces an industry-first edge content delivery network for websites and creators; bringing the fastest pages on the web to Ezoic publishers.
Launch
Ezoic Unveils New Enterprise Program: Empowering Creators to Scale and Succeed
Ezoic recently announced a higher level designed for publishers that have reached that ultimate stage of growth. See what it means for Ezoic users.
Announcement