
The State Of Page Speed In 2020: Statistics Publishers Need To Know

Get helpful updates in your inbox
Publishers in the new year might wonder where the state of page speed stands in 2020. In 2019, Google introduced the Chrome User Experience Report and announced the upcoming badge of shame in Chrome browsers. These types of changes make it clear that the conversation of site speed and its relation to SEO isn’t going away. Additionally, page speed statistics from Google demonstrate the relationship speed has with bounce rate and other engagement metrics.
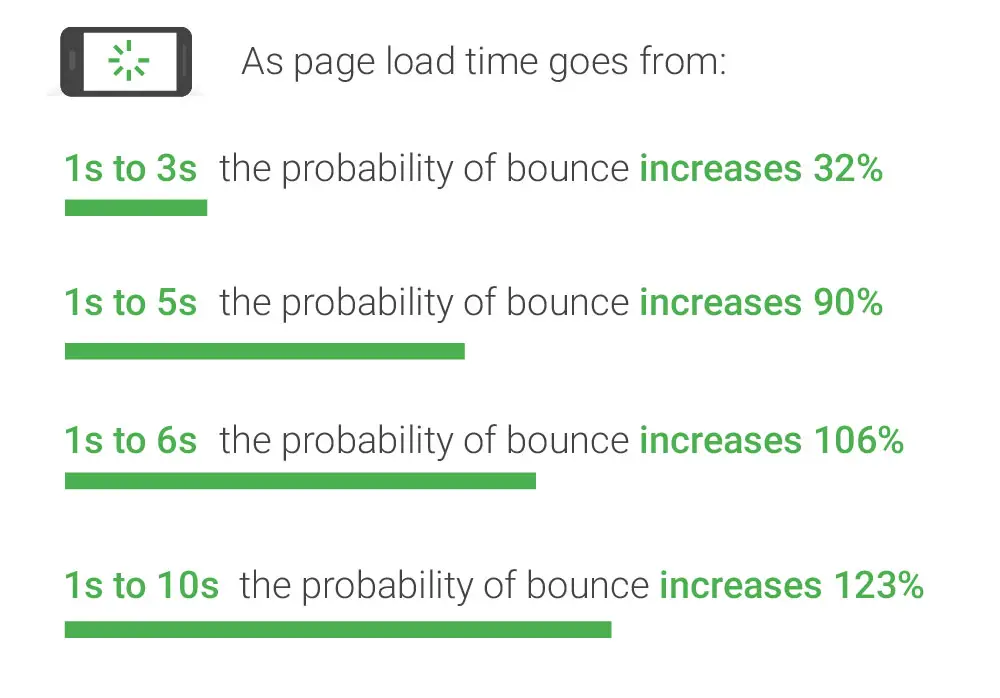
The issue with statistics like the one above from Google is that they offer no advice alongside the data. If they do provide context, it is often intentionally vague. These “soft” recommendations give Google flexibility with its stance on speed. However, their vagueness might prove to be a double-edged sword.
Google has said that they only penalize websites that are perceivably slow to users. But what if this stance changes? It is in the best interest of publishers to stay ahead of the curve of page speed. Moreover, if Google decides to become stricter with site speed and how it affects SEO, your site won’t be harmed.
To see where publishers websites stand in 2020 and beyond, we collected page speed statistics from over 5000 sites on the web.
What are the page speed statistics publishers need to know about in 2020?
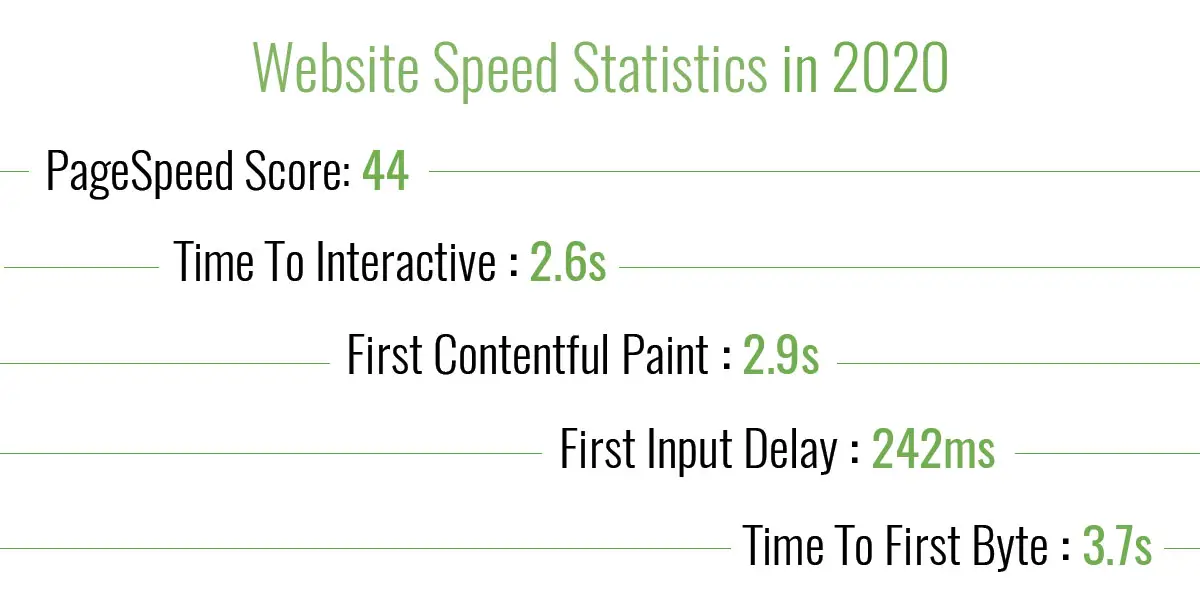
The average page speed statistics in 2020 for the sites studied were:
- PageSpeed Insights Score: 44
- Time To Interactive (TTI): 2.6 seconds
- First Contentful Paint (FCP): 2.9 seconds
- First Input Delay (FID): 242 milliseconds
- Time To First Byte (TTFB): 3.7 seconds
What is the significance of these metrics? The easiest insight to draw from the data is that publishers have a difficult time achieving high PageSpeed Insights scores. The average score was 44, which is “poor” in the eyes of Google.
Additionally, TTI, FCP, FID, and TTFB were within the “moderate” range. These times would likely return a “moderate” score from PageSpeed Insights in the 50th—75th percentile in comparison to Google’s lab data and field data of sites on the web. But publishers might wonder, what is the significance of these metrics?
Time to Interactive (TTI)
Time to Interactive is the amount of time it takes for the content on your page to become ready for a user to interact with it. This is an important metric to look at if your content is dynamic. We also wrote a blog about whether TTI impacts website revenue and performance.
For example: Let’s say your website is a messenger application. If your FCP is fast, the user can see their message history very quickly. But if your TTI is slow, let’s say it takes the user 10 seconds to be able to click into the input field to type. That’s not “fast” at all.

The example above is the kind of scenario Google is penalizing in search rankings. They want to ensure users have perceivably fast experiences on the web.
First Contentful Paint
First contentful paint (FCP) is when the browser renders the first bit of content from the DOM (API interface), providing the first feedback to the user that the page is actually loading. This is a timestamp is created by the first text, images, non-white canvas, or SVG to render.
First Input Delay
First input delay (FID) measures the time between when a user first interacts with your site (i.e., when they click on something) to the time the browser is able to respond to the interaction.
Time to first byte (TTFB)
Time to First Byte measures the duration from the user or client making an HTTP request to the first byte of the page being received by the client’s browser.
In reality, TTFB is useless to the end-user. It is actually only accurately measured at the server itself so that network waiting time isn’t factored into the calculation. A single website could be tested by speed testing tools at different locations around the globe and get completely different results.
The reason why TTFB is a longer time than the other metrics in our data is likely because Backlinko found the average desktop Time to First Byte (TTFB) speed is 1.28 seconds on desktop and 2.5 seconds on mobile. Publishers can often increase their TTFB by upgrading their hosting provider or using a CDN.
Which page speed statistics are most important to make my site faster?
It depends. Google has said that the recommendations given in PageSpeed Insights or Lighthouse are simply that—recommendations. They present an opportunity to find the low-hanging fruit on your site to then fix and improve your page speed over time.
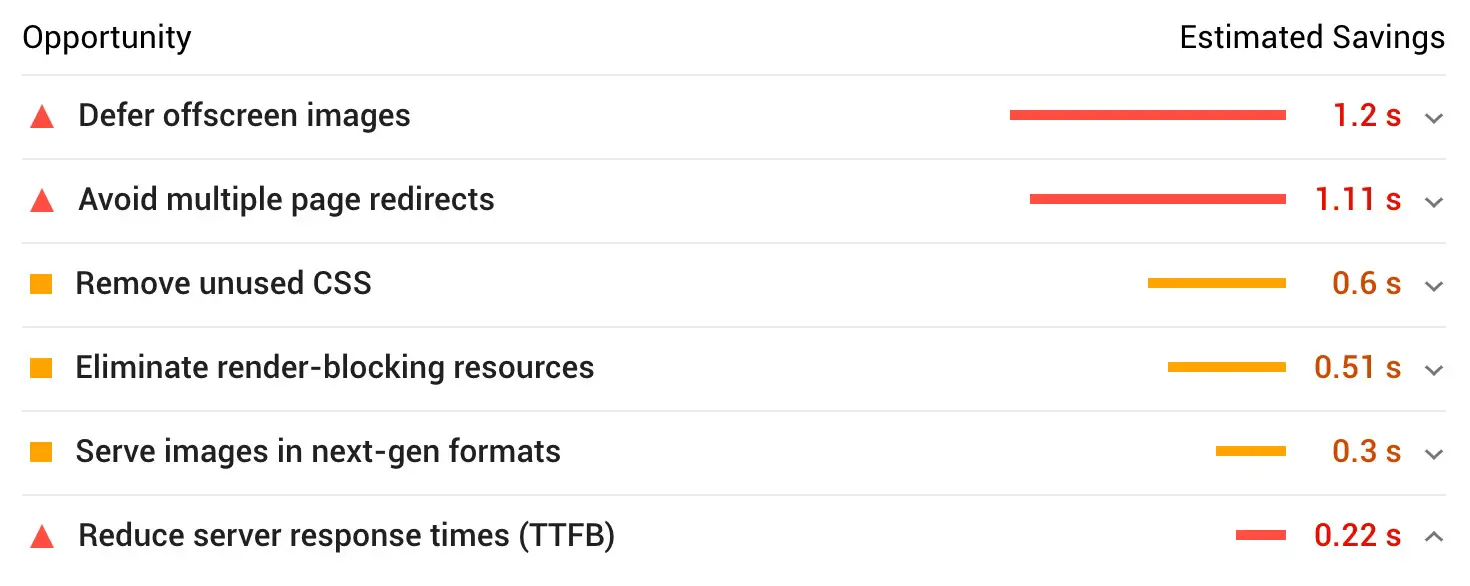
The data from these websites we tested show that publishers may have a low PageSpeed Insights score, yet a moderately fast FCP or TTI. Or a TTFB that’s slower than FCP or TTI.
Remember: Seeing how your site’s speed is from the perspective of a user is the foundational advice Google webmasters give publishers—and for good reason. Proper caching setup, CDN use, and adhering to site speed best practices should help you ensure your users are happy.
We have also written a number of blogs on how to increase page speed and make your website faster:
- Which WordPress Plugins & Themes Can Speed Up Your Website?
- Improve Site Speed Scores By Lazy Loading Images & Serving Next-Gen Formats
- 5 ways to make a website faster that most publishers aren’t doing
- Speed Up WordPress Websites Instantly Using These 5 Tips
- Improve Page Speed For Google SEO In Actionable Ways
Wrapping up the page speed statistics publishers need to know in 2020
The data from these 5,000 sites are evidence that low site speed scores are an issue that most sites share. We’ve seen many publishers obsess over their scores. They do anything possible to give their site’s speed audit scores like PageSpeed insights, a boost, along with trying to shave off milliseconds off of some of these speed metrics.
Some of the recommendations that Lighthouse audits provide, if addressed, can dramatically improve your site’s speed scores and actual site speed. Some of these recommendations include:
- Optimize critical CSS
- Lazy-load images
- Next-gen formats
- Resize images
- Efficient static cache policy
- Pre-connecting to required origins
Ezoic has engineered a solution to site speed that optimizes all of the items from the bulleted list above—with just the click of a button. Moreover, it puts an end to the endless plugins, widgets, and scripts that can actually have the opposite effect and bog down your site’s speed.
The Site Speed Accelerator gives you the ability to perceivably increase site speed for your visitors along with eliminating low speed scores for good. You can learn how to get an 80+ Mobile PageSpeed Insights score in the video below by using the Accelerator’s recommended settings.
Do you have any questions on any of these page speed statistics or how your site compares to the data? Let me know in the comments.

Allen is a published author and accomplished digital marketer. The author of two separate novels, Allen is a developing marketer with a deep understanding of the online publishing landscape. Allen currently serves as Ezoic's head of content and works directly with publishers and industry partners to bring emerging news and stories to Ezoic publishers.
Featured Content
Checkout this popular and trending content

Ranking In Universal Search Results: Video Is The Secret
See how Flickify can become the ultimate SEO hack for sites missing out on rankings because of a lack of video.
Announcement
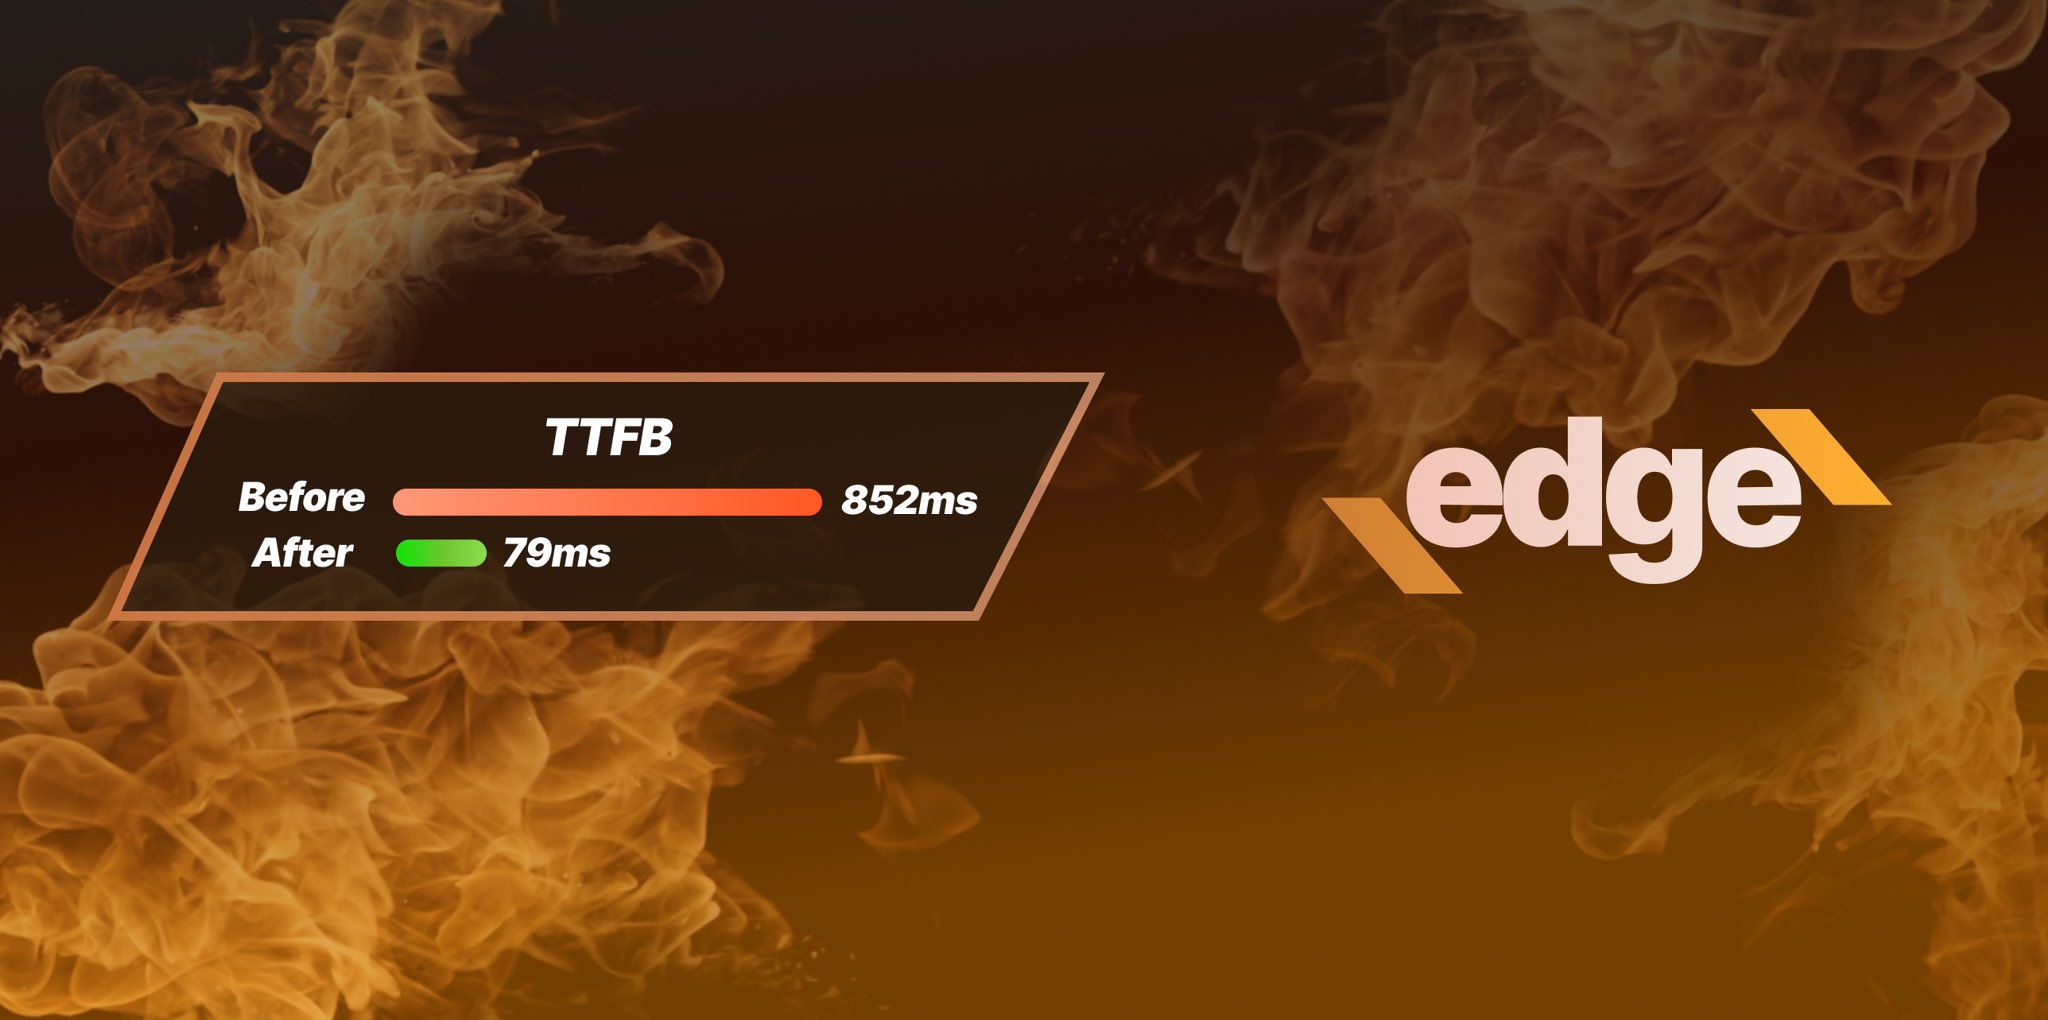
Ezoic Edge: The Fastest Way To Load Pages. Period.
Ezoic announces an industry-first edge content delivery network for websites and creators; bringing the fastest pages on the web to Ezoic publishers.
Launch

Ezoic Unveils New Enterprise Program: Empowering Creators to Scale and Succeed
Ezoic recently announced a higher level designed for publishers that have reached that ultimate stage of growth. See what it means for Ezoic users.
Announcement
