
Maximizing Digital Revenue Using Often Neglected Insights

Get helpful updates in your inbox
Maximizing Digital Revenue Using Often Neglected Insights
If you’re a creative type, it’s easy to get into the groove of writing, publishing, publicizing, and repeating. We’ve been told for many years that content is king and that more content = more traffic. The problem is, just like a book author who never reads reviews and never listens to feedback from readers, not paying attention to feedback is a bad idea; especially when it comes to maximizing digital revenue.

Imagine how much better a book author gets when they listen and learn from their readers. Now, picture how beneficial it is as an online publisher to do the same: analyze your site traffic, identify which topics resonate the most with your visitors, and see which ones are really contributing the most to the bottom line.
This is not going to be some boring old post about analyzing traffic or CPM’s (or RPM’s). In the text below, I’ll highlight some metrics, math, and insights that most publishers fail to take into account when they create new content, try to maximize the value of their existing content, and think strategically about the future of their site.
Using Neglected Analytics Data To Maximize Digital Revenue
Some of the data we are about to look at may be data you look at every day; however, I’m going to give you a few new ways to think about in the context of maximizing digital revenue. The other information we’ll look at may be something you aren’t currently tracking.
I use Ezoic’s Advanced Analytics (free to join platform) to analyze my own pages on Ask Dave Taylor, so check out Figure One, where it shows a series of different URLs organized by Visits, with lots of other data shown too:

First, let’s really break down my top line visitor stats. In this image, why are Page Views greater than Visits? That’s an easy one: if someone hits a page more than once in the time period of the report, they’ll be one visit but multiple page views. That’s most commonly on the home page of a site, as you can see (27K visits versus 30K page views).
The more interesting stats are the subsequent columns. For example, PV/Visit lets you answer the question Which of my pages bring visitors who check out the most additional pages? In the data shown, that’s “F” and “G”, both of which have 1.09 PV/Visit, while the last one, “H”, has the worst with 1.04 PV/Visit. Your numbers will vary, of course, but you’re getting the idea.

This is incredibly important to know; as more PV/V has a direct correlation with revenue. You can see this a bit in my charts, but there was a whole study done on this recently. Tracking this, using it as a marketing KPI, and writing new content based on existing content that has good numbers here can offer a lot of value to publishers.
Similarly, the Bounce Rate lets you answer the question Which pages are most likely to cause someone to immediately bail on my site? And on my site the variance is huge: People visiting page “C” are quite likely to hit another page (Bounce Rate of 13%) whereas people hitting page “G” are more likely to bail than proceed (61% Bounce Rate).

EPMV is a true north metric for publishers
The column I pay the most attention to in these reports is EPMV (earnings per thousand visitors) because I’m always trying to ascertain not just which topics are the most interesting, but which are the most profitable from a digital revenue perspective? Why EPMV instead of eCPM or RPM? That’s easy, you can check out this article on why EPMV will always keep you pointed in the right direction while eCPMs and RPMs could have you making less money even though those metrics are increasing.
EPMV answers a lot of important questions once you understand it. For example, you can see that page “H” might generate a lot of traffic, but it has almost no revenue, with a pathetic EPMV of $0.74. By contrast, 1000 visitors to “D” will generate $11.90, quite a healthy EPMV.
Note: Page “H” is some adult oriented content so some of my ad networks refuse to show on that page, which is why its revenue is so miserable.
Landing Pages vs. Pages
What I really want, however, is to be able to identify which pages bring in the most overall revenue. However, this is a major area where publishers make a big mistake. Remember how we talked about how valuable that PV/visit was earlier? This ties in with the idea that publishers should be spending more time looking at landing pages than pages.

Why? Understanding which landing pages produce the highest EPMV will actually tell you what content is actually the most valuable on your site. A page with a high net earning may look good, but may actually earn less than a modest earning page that generates a lot of additional Page Views.
This is like gold for content teams trying to determine which types of content to write about next. Perhaps a series of articles on a particular topic; resulting in multiple PV/visit produce more overall digital revenue than high earning target pieces of content that have no follow-up for visitors (higher bounce rate)?
Additional ways of normalizing page value
One of the things I personally struggle with is weighing my content based on how much revenue it generates vs. how much traffic it actually receives. How should I approach creating new content if I can’t really determine which is producing the greatest average value?
One way I calculate that is by normalizing EPMV and then multiplying it by total page traffic. For example, page “A” is worth:
19689 * ( 6.09 / 1000 ) = 119.90
Not bad for a single Web page. Certainly when compared to page “H” which generates plenty of traffic but almost zero revenue (10,661 * ( 0.74 / 1000) = $7.88). You can easily calculate this for by pulling out the EPMV’s by landing page by yourself from Ezoic reporting then exporting the data into a spreadsheet like Numbers or Excel and apply this particular formula.
What can you do with these insights
Now, armed with your most valuable landing pages and normalized pages (if this is helpful to you) by EPMV, what can you conclude? What topics do your readers really appreciate and stick around to read? And, most importantly, what are you going to be writing about tomorrow?
This information should give you much greater insight into what pages you should actually be driving traffic to and what types of content are really earning you the most digital revenue. This is information every content team and social media team should be used to help contribute to bottom line growth.
Featured Content
Checkout this popular and trending content

Ranking In Universal Search Results: Video Is The Secret
See how Flickify can become the ultimate SEO hack for sites missing out on rankings because of a lack of video.
Announcement
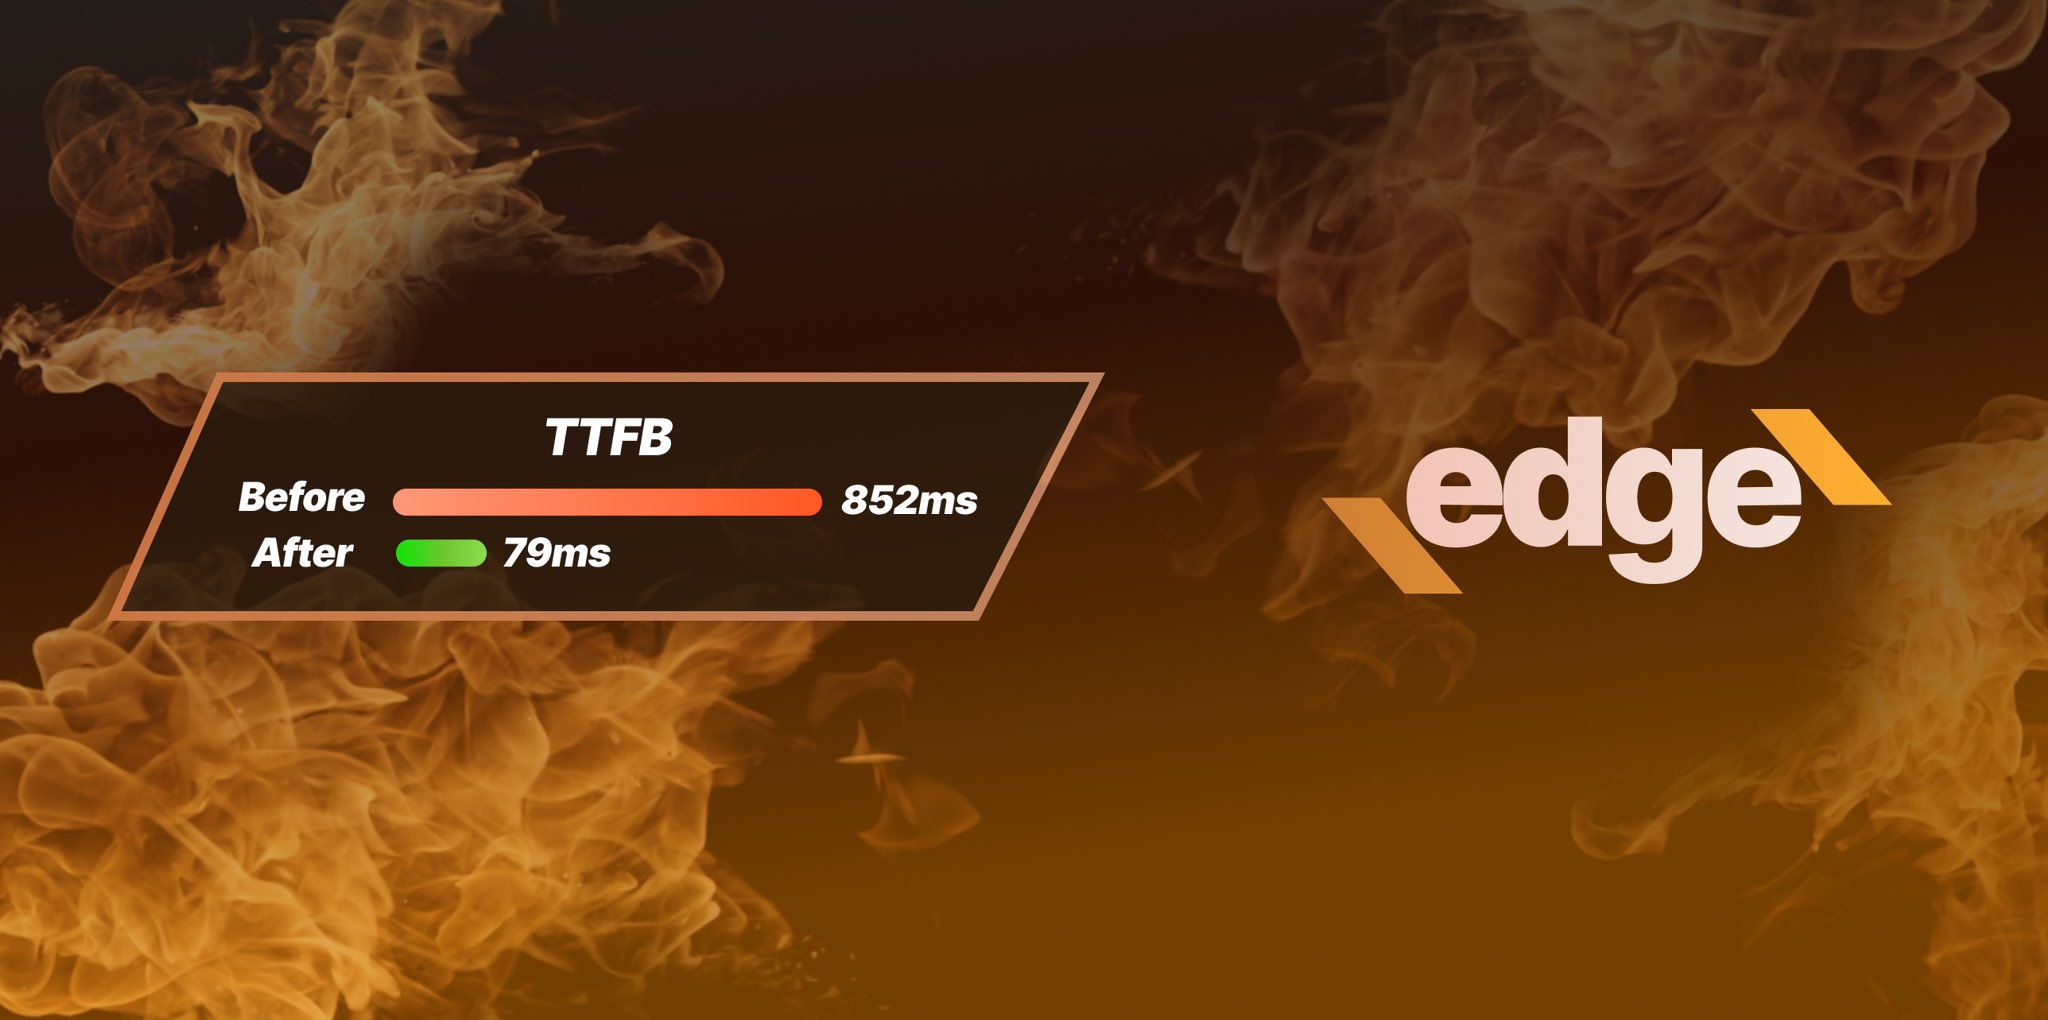
Ezoic Edge: The Fastest Way To Load Pages. Period.
Ezoic announces an industry-first edge content delivery network for websites and creators; bringing the fastest pages on the web to Ezoic publishers.
Launch
Ezoic Unveils New Enterprise Program: Empowering Creators to Scale and Succeed
Ezoic recently announced a higher level designed for publishers that have reached that ultimate stage of growth. See what it means for Ezoic users.
Announcement