Lab, Field, and Origin Data: What’s the Difference and How They Impact Core Web Vitals

Get helpful updates in your inbox
You may have seen this terminology thrown around in relation to your Core Web Vitals and site speed. If you’ve ever been confused, you’re not alone.
We’ll break down all the categorizations so you can know what you’re looking at and what it means. Next time you’re doing a deep dive on your data in the Ezoic dashboard, you’ll be an expert and have the know how to make decisions based on your Core Web Vitals.
Before we begin, be sure to take a look at another blog talking about tracking Core Web Vitals the way Google does. It will give you a better understanding of how to find big data, look at it historically, and what it means with impacts to your site.
Another helpful piece of info is from the Google Developer page on all the key metrics you’re seeing in the report and what they mean.
Lab Data
First, lab data is data that’s tested on a machine within a controlled environment. Lab data in a sense is synthetic.
It has the strength of giving you reproducible results that are helpful for debugging your site and the ease of pinpointing areas that need improvement. Lab data gives you instant feedback. So if you’re retooling, this is where you’ll see scores change quickly and in response to your actions.
Conversely, the data may not be able to represent any real problems your users could encounter.
We will cover it more, but the origin summary and field data have no bearing whatsoever on the score you see in lab data, it is purely informational.
Field Data
As the name infers, this data comes from real users. It’s a 28-day average of data collected from users that captures a real experience and makes it easier to correlate with a businesses’ KPIs. And it’s the only data set in this blog that is factored into your Core Web Vitals.
Field data is a breakdown by page of real-world data and actual users. With that said, this data will only populate if you have enough traffic. Now, important to note, Google doesn’t indicate the amount of traffic needed, they will simply tell you whether or not you have enough to generate the report.
This is where data will vary from the field. In the real world, people have a mixed bag of connection speeds and devices and caching has a significant impact as well.
While it’s useful to know what issues your audience may be facing, the glaring weakness of field data is that it is limited for debugging because of its nature, being a 28-day average. You can’t expect to adjust your site and see it immediately reflected in field data.
Additionally, it requires large amounts of visits and pageviews that your site may not have yet.
Origin Summary Data
Similar to field, the origin summary data is an average of all pages that Google has for your entire site. This data comes from their Chrome UX database. Although this data set is extremely valuable, Google does not factor it into a site’s Core Web Vitals.
A piece of clarification – origin summary data isn’t the aggregate of all your pages on the web, it’s just pages that have enough data in the CrUX dataset. This is why a brand new site will not have any origin data or field data alike.
If you’re wondering, these data sets don’t interfere or overlap. No CrUX data is used in the score or in the lab data.

What should I care about most?
In short, the origin summary data. The reason we say this is because it’s the more cohesive measurement of your website in its entirety.
Looking at the aggregate experience of all the pages you serve, and how they perform in the Core Web Vitals assessment is the most helpful indicator you can have for your site’s strengths and weaknesses.
However, if you only care about boosting your Core Web Vitals and you have field data available, it’s important to analyze that as well. Lab data can also be useful if you’re looking for instant feedback.
You can only work with the data you have, so in the instances of smaller publishers, you must draw conclusions from your lab data and turn it into action items to improve your Core Web Vitals to your best effort.
Everything aside, there’s room and applications for every data set we’ve covered.
Using Leap
Before Leap, many users were without access to any data and furthermore didn’t have any insights into their Core Web Vitals. This is mainly attributed to the fact that publishers haven’t gotten enough traffic to their sites and couldn’t gather any field or origin data.
Now, we’ve given lab data to publishers.
We’ll show you how Ezoic explains this to users.
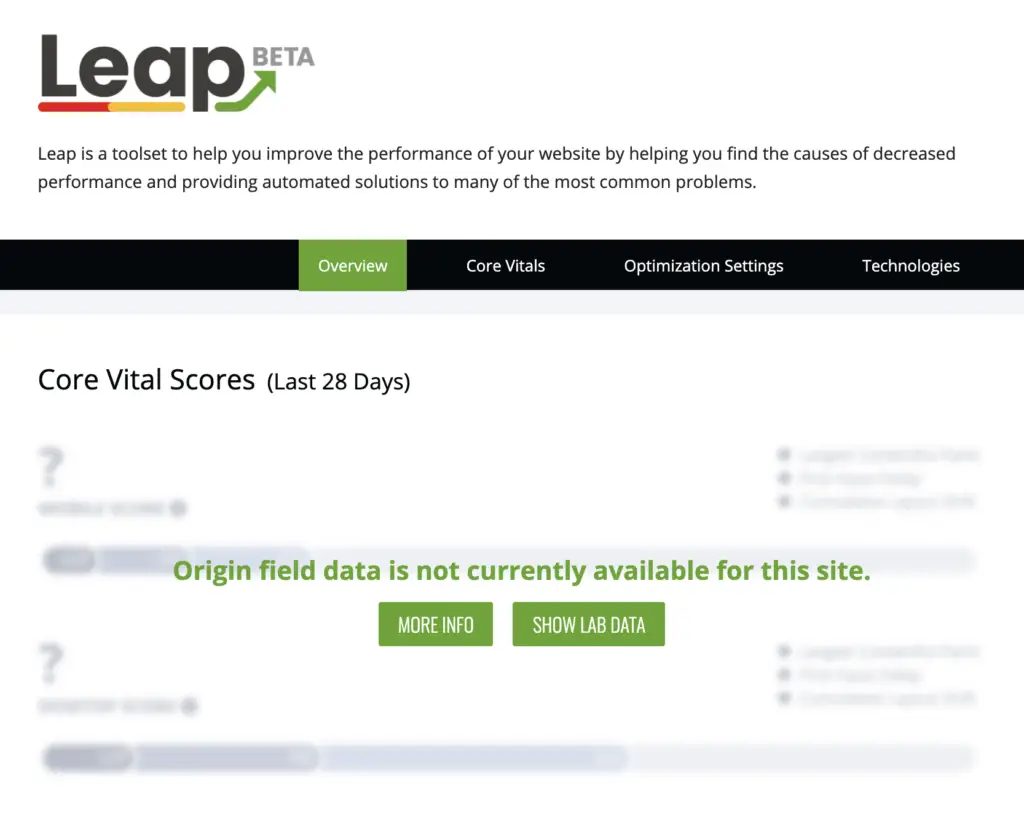
This is what you’ll initially see if you don’t have field data.
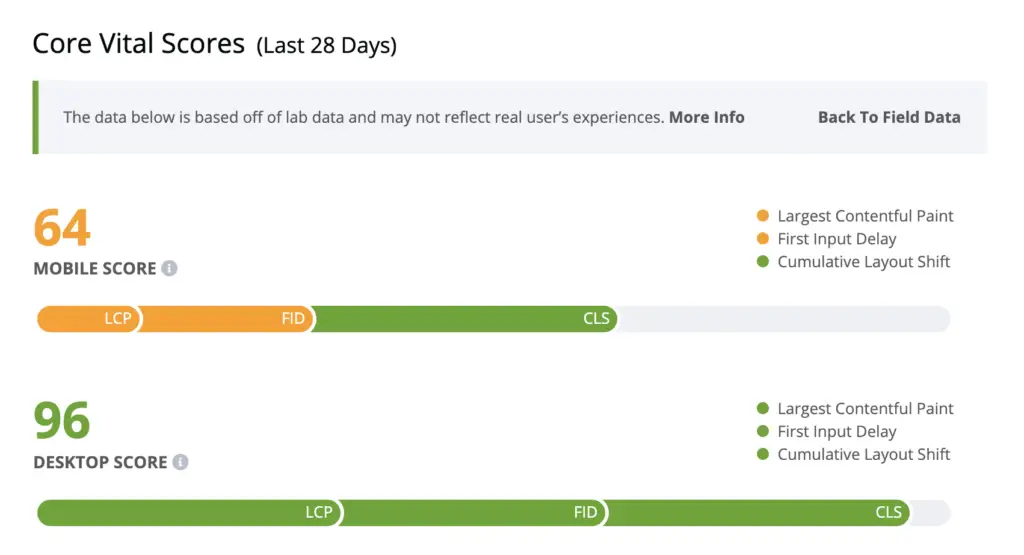
After you choose to show lab data, here is what you’ll see. The note at the top is important to read also, saying that the data shown may not reflect real user’s experiences.
If you expand, we let you know that,
“Field and Origin Data are populated using real user data found in the Chrome User Experience Report (CrUX) provided by Google. If a site does not have the enough Real-User data to generate this report, you will not see metrics displayed here.
For sites with no Field or Origin data it is best to optimize using Lab Data. Lab data uses emulated testing conditions to provide publishers a way to test and optimize for User Experience and Site Speed while unable to generate field data reports.“
Our data is the exact same as Google’s. We report your field data that’s the same as in Search Console and your lab data is the same as PageSpeed Insights and Lighthouse. Having it all in one place along with our recommendations makes Ezoic and Leap a full service, Core Web Vitals friendly platform.
In Conclusion
At Ezoic we talk a lot about the relationship between information and data. Our goal is to draw conclusions from data and create information. In other words, what does all this data mean?
In this space, it’s tough to digest everything that you can see even in one pane. With this, we hope you could gain a better grasp on the data sources you’ll be seeing in your Ezoic dashboard.
In other news, take a look at the 3 Tools That Helped This Publisher’s Site Earn More Revenue
Erik is a digital marketing and content creation expert. Erik has consulted and developed media for brands, earning accolades for his agile tactics and lean marketing approaches.
Featured Content
Checkout this popular and trending content

Ranking In Universal Search Results: Video Is The Secret
See how Flickify can become the ultimate SEO hack for sites missing out on rankings because of a lack of video.
Announcement

Ezoic Edge: The Fastest Way To Load Pages. Period.
Ezoic announces an industry-first edge content delivery network for websites and creators; bringing the fastest pages on the web to Ezoic publishers.
Launch

Ezoic Unveils New Enterprise Program: Empowering Creators to Scale and Succeed
Ezoic recently announced a higher level designed for publishers that have reached that ultimate stage of growth. See what it means for Ezoic users.
Announcement