What’s A Good Bounce Rate (Plus Other Engagement Metrics) In 2020?

Get helpful updates in your inbox
A good bounce rate for your site is mostly dependent on the type of website. Content websites have average bounce rates between 40-60%, while service and retail sites see average bounce rates between 10-40%. Blogs tend to have the highest average bounce rates, between 70-98%.
Most digital publishers understand that there’s a relationship between bounce rate and user experience. Key players in the digital publishing industry know this information as the status quo.
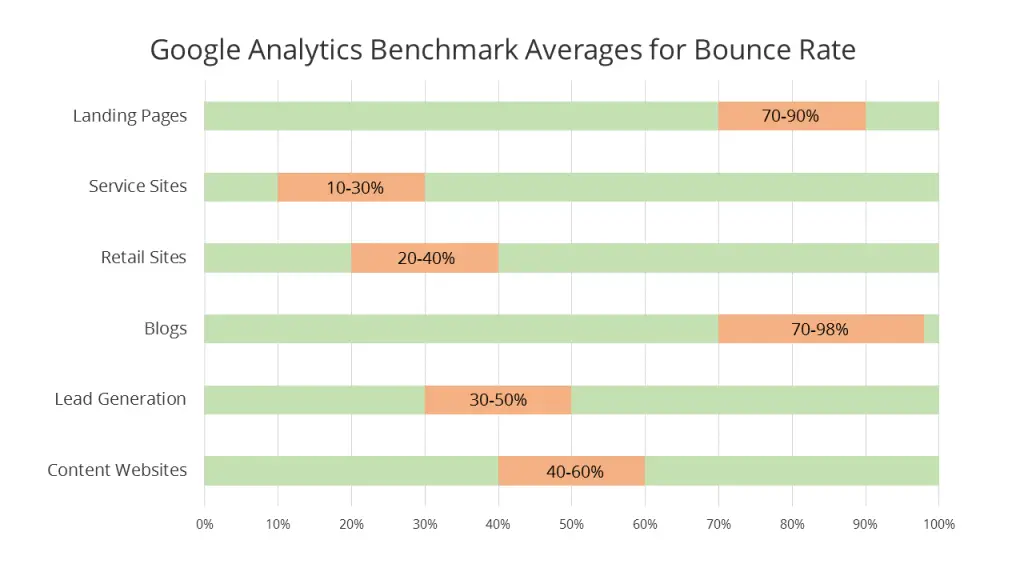
Google even gives you the ability to benchmark your site’s performance compared to your peers. But in reality, how relevant are these bounce rate ranges that are tossed around online?
To answer this question, we ran the data of thousands of websites using Ezoic to get engagement metrics by site category.
What are the categories of sites with the lowest bounce rates?
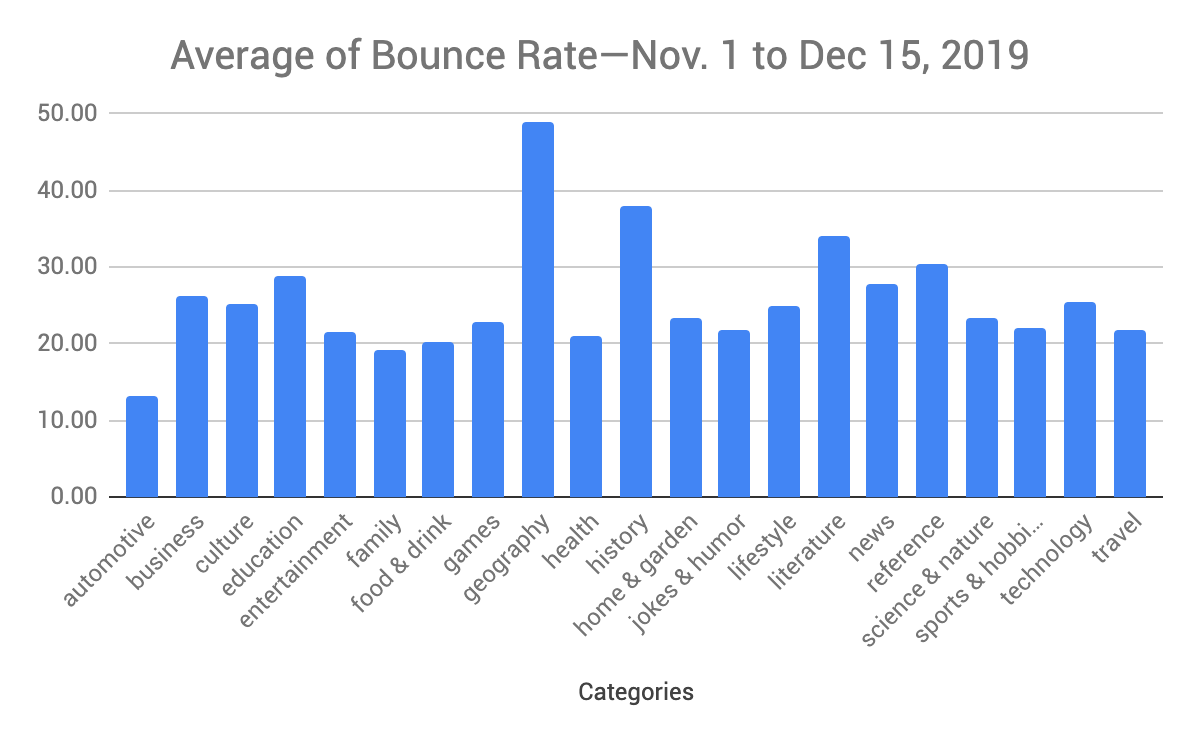
The categories with the lowest bounce rates were automotive, family, food & drink, and health.
Correlating these categories’ low bounce rates to user behavior seems anecdotal. However, if you think about the type of content on these sites, the results begin to make more sense. Take the website examples below as a reference.
Automotive: Long-form, “how to” content on maintaining Jeeps.
Family: A resource hub filled with content catering to parents with newborns.
Food & Drink: Vegan dessert recipes.
Health: Information on the prevention and management of Type 2 diabetes.
Fixing a car can be complicated. Parents may consistently Google info throughout the first few years of childhood. Recipes often take a careful eye and require staying on the same page for long periods of time. People with chronic conditions want to stay up-to-date with the latest research and treatments.
These site categories share one main characteristic: the content helps answer questions or provides information about topics of high importance to the visitor.
What are the categories of sites with the highest bounce rates?
The only categories with the highest average bounce rates were geography, history, literature, and reference.
Think about these categories from the perspective of how a user interacts with them. If you’re searching online for an answer to your question on history, geography, literature, or something of reference—chances are the answer on a site will quickly and directly answer your query.
Where did Abraham Lincoln grow up? Which city is the most populated in Montana? What is the plot synopsis of Wuthering Heights? What are the different tenses of lay/lie?
If these questions aren’t already rich snippets in Google’s knowledge graph, a user might click the top result, get their answer, and then leave.
Why are the bounce rates in the graph unusually low?
The bounce rates in the above graph are a lot lower than most publishers are used to seeing in Google Analytics. The way Google Analytics measures bounce rate is fundamentally flawed, and the data we provide in this blog was pulled from Ezoic’s Big Data Analytics. Google Analytics defines a ‘bounce’ as any visit where a user only views a single page. This approach doesn’t accurately reflect user interest.
For example: a user lands on a page of your site, spends 10 minutes reading the entire article and then navigates away, Google Analytics counts this as a bounce. Ezoic’s Big Data Analytics views this interaction as a success since the user most likely found what they were looking for.
Which categories of sites had the highest average time on page?
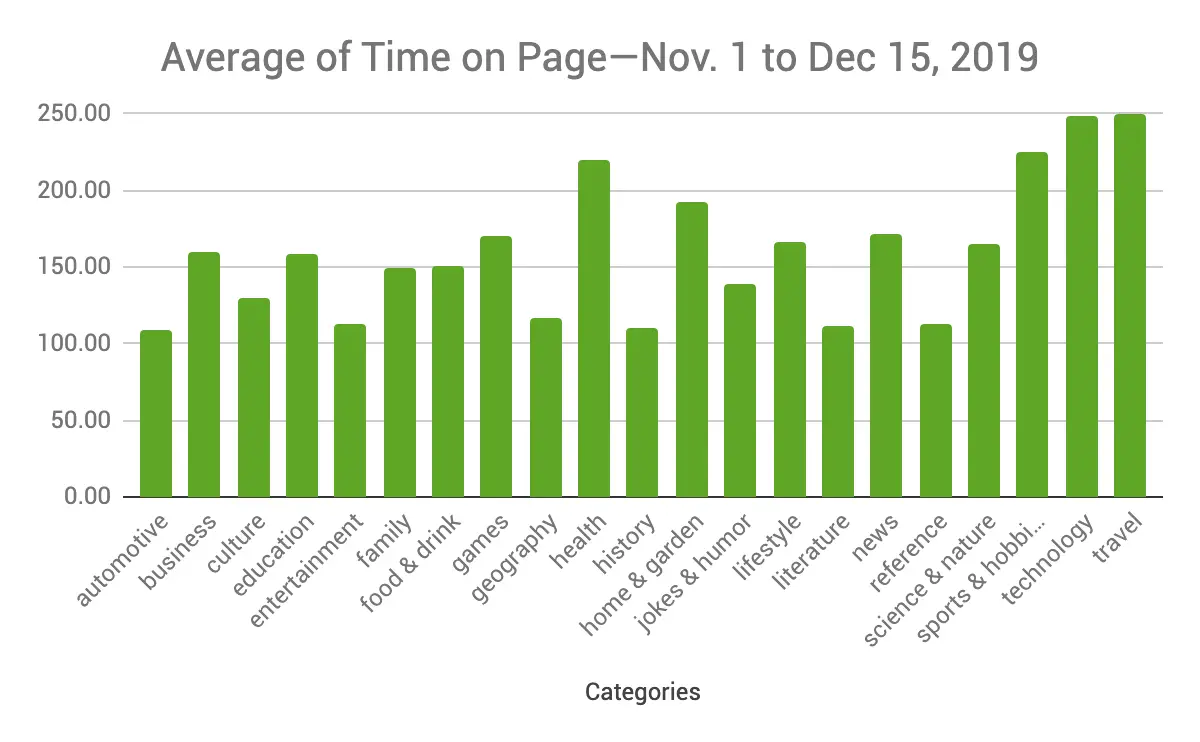
Travel, technology, sports & hobbies, and health had the highest average engaged time. The visitors to sites within these categories spent more time with the content in an active browser tab, scrolling, copying/pasting text, etc.
Additionally, with this graph, bounce rate seems somewhat inversely correlated with the “average time on site” graph (higher bounce rate, lower time on page). This finding was only significant enough with those 4 specific categories: geography, history, literature, and reference.
What are the average engaged times by site categories?
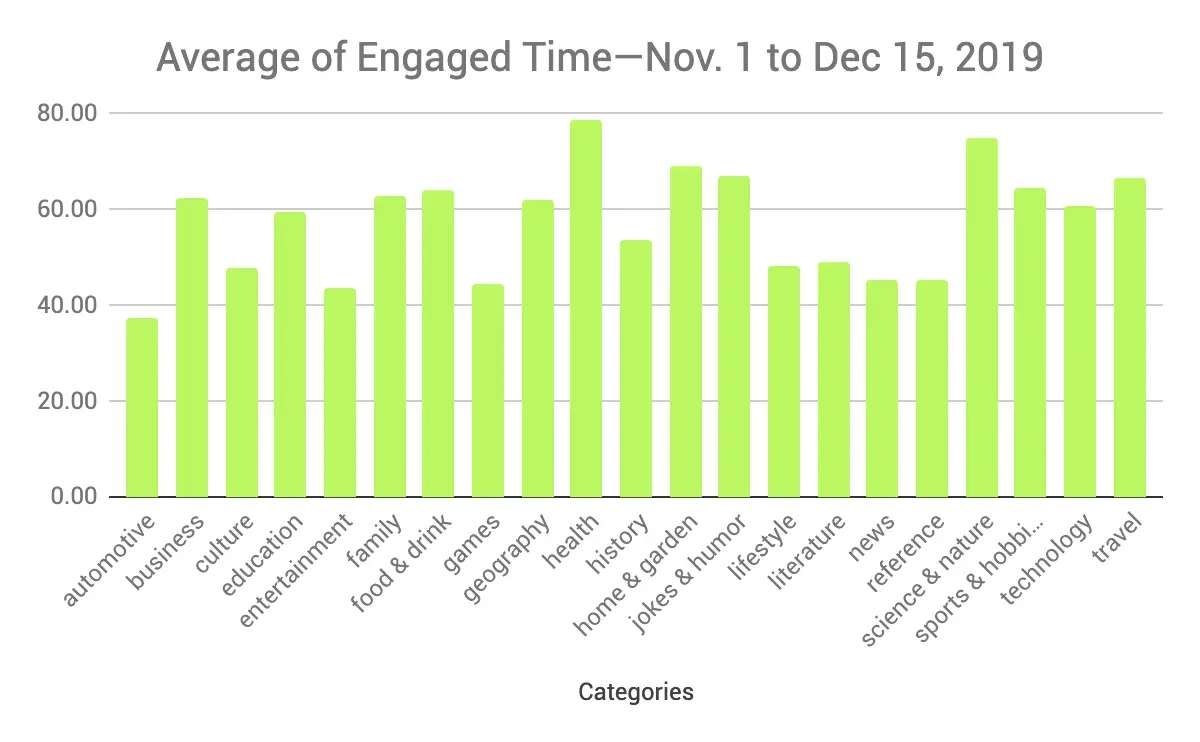
The top four categories for average engaged time are health, science & nature, home & garden, and jokes & humor.
Why might the engaged time be higher for some of these categories? Health is a category that can have a big impact on someone’s life. Visitors might spend more time on the site, read content more carefully, copying and pasting text, etc.
Google realized these YMYL (Your Money, Your Life) sites have the capacity to greatly impact someone’s general well-being. Lower-quality sites in those categories were hurt after the Google Medic update in August of 2018. If you have a site that falls within the business, health, or lifestyle category—we wrote a guide on how to add authority to YMYL topics.
Remember: Engaged time on page is different than time on page. ‘Engaged’ time is considered when the visitor is actively on your site and not in another browser or tab. It’s when they’re scrolling / moving the mouse around the screen and actively engaging with the site’s content. Time on page is the time a user spends on your website. This is often referred to as “session duration”.
Can good bounce rates and engagement metrics coexist with display ads?
It’s well-known throughout digital publishing that ads on a website impact user experience. There are a variety of ways publishers try to counteract this phenomenon:
- A/B test: Are 6 ads on a page better for UX, or is it 7? Let’s say 60% of people prefer layout A with 6 ads, but 40% preferred layout B with 7 ads. If you choose the option preferred by the majority, you’re now losing out on the 40% of the audience that preferred something different.
- Ad-ops shops/third-party monetization: jamming a lot of ads on the page to gain a higher total eCPM (total price paid for all the ads on a page). This may earn a publisher more money in the short term, but in the long term, ad dilution happens. Additionally, more ads on the page may cause visitors to visit fewer pages, leading to lower ad revenues.
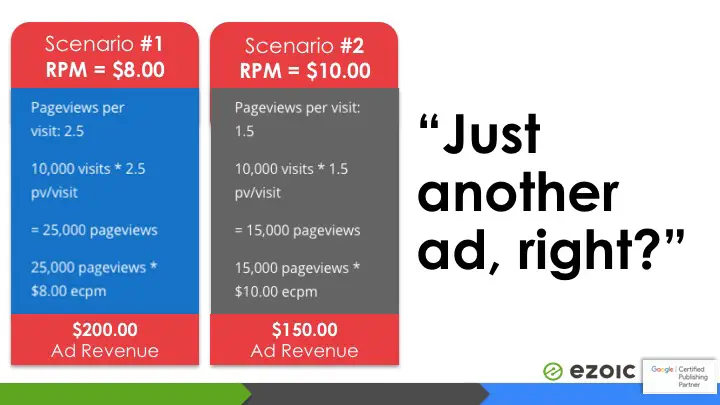
Moreover, RPM does not take into account earnings, visitors, SEO, and critical UX metrics that tend to drive a site’s long-term success.
In the case of a publisher who monetizes with programmatic ads, the two main competing goals are UX and ad revenue. The only way to shrink the gap between these two competing goals over time is by continual multivariate testing. A large team of people would find incredibly difficult to do this type of testing on a per-user, per visit basis. Ezoic’s software uses real machine learning to grow ad revenues and improve user experience over time.
So, do you really need a good bounce rate in 2020?
Despite what some SEO gurus might claim, bounce rates depend on many factors outside of just the “type” of site you have. While site categories affect ad revenues more directly than they do engagement metrics like bounce rate, there are still ways to improve visitor engagement regardless of your site category.
Publishers can try and test these tactics that the data have shown to improve SEO, time on page, scroll depth, and engaged time on page:
- Writing long-form articles (Additionally, use the inverted pyramid style of writing)
- If you produce unique video content, embed a video that’s relevant within your post
- Strike the right balance of display ads throughout your site
- Write step-by-step “how-to” content that’s relevant to your niche
- Avoid mobile optimization errors on your site
Do you think a good bounce rate is important for your site? Let me know in the comments.
Allen is a published author and accomplished digital marketer. The author of two separate novels, Allen is a developing marketer with a deep understanding of the online publishing landscape. Allen currently serves as Ezoic's head of content and works directly with publishers and industry partners to bring emerging news and stories to Ezoic publishers.
Featured Content
Checkout this popular and trending content

Ranking In Universal Search Results: Video Is The Secret
See how Flickify can become the ultimate SEO hack for sites missing out on rankings because of a lack of video.
Announcement
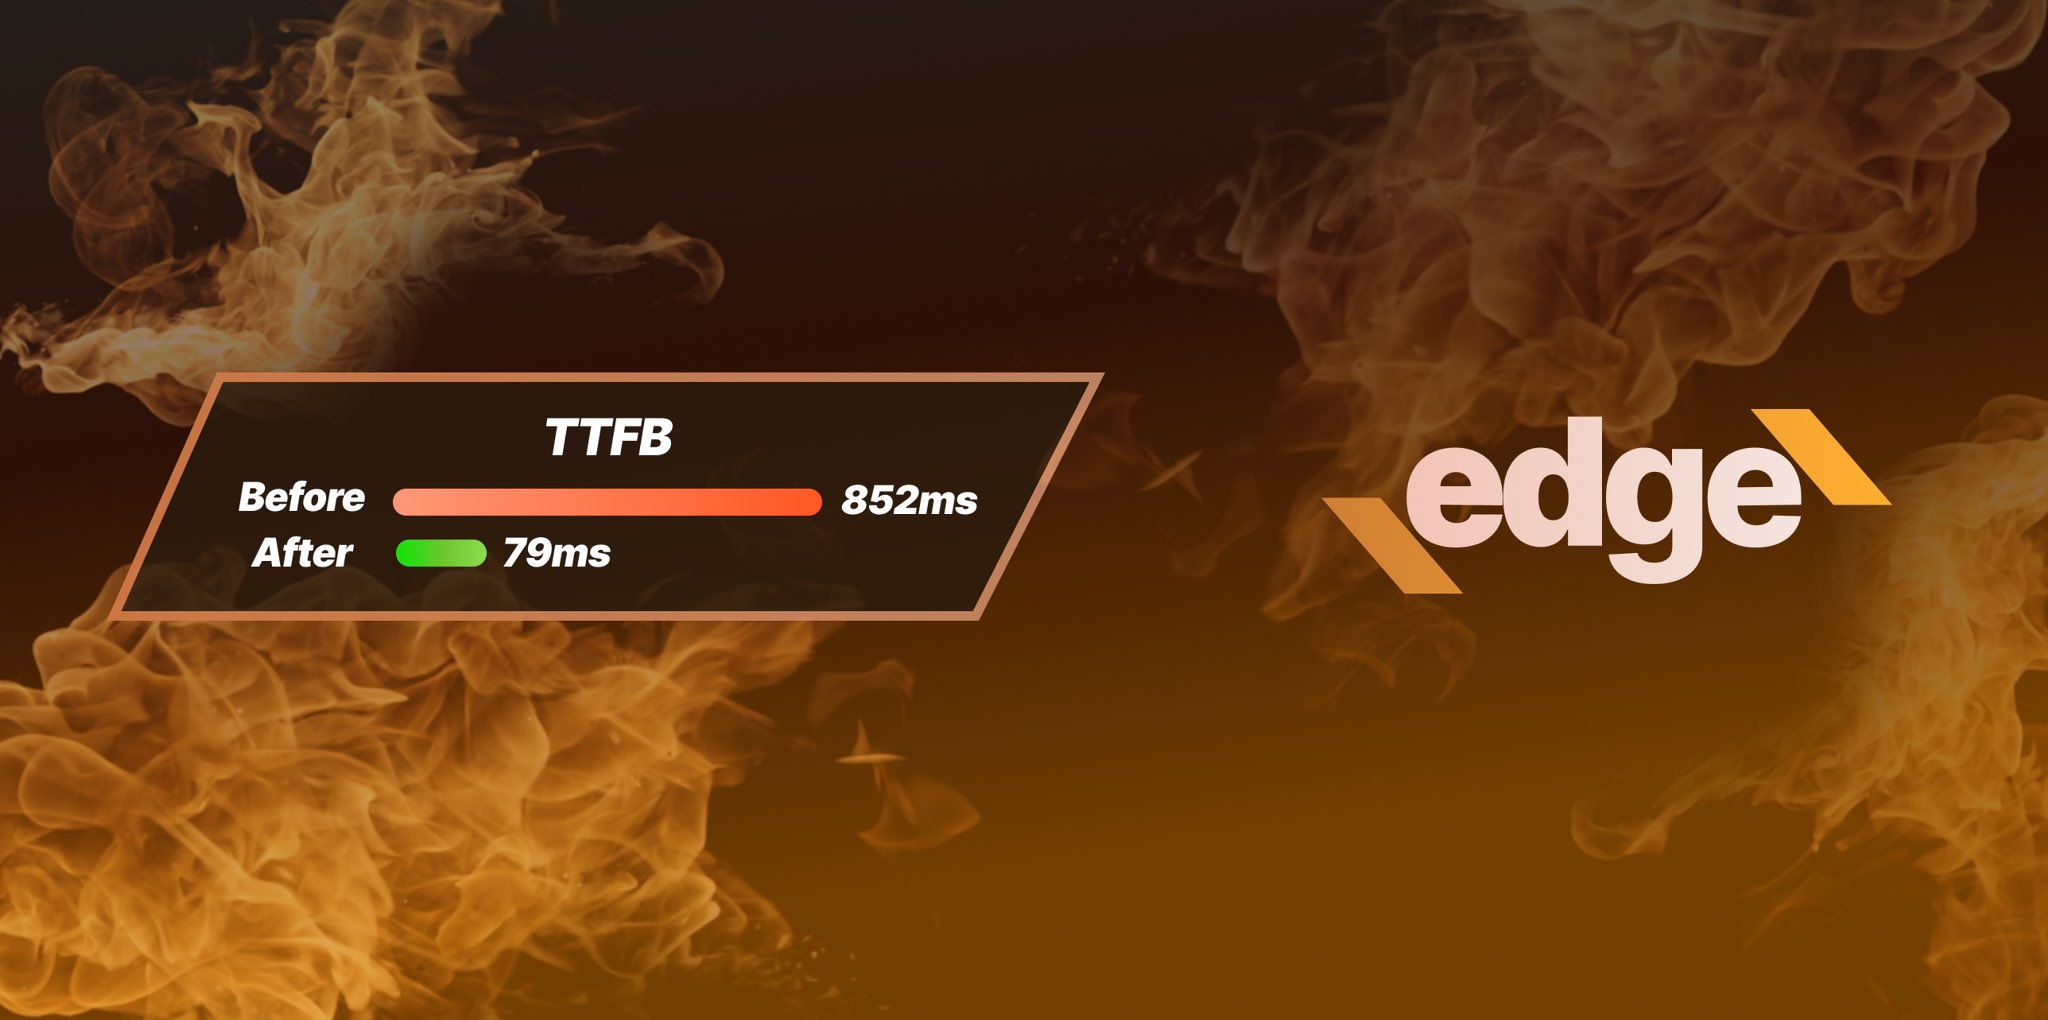
Ezoic Edge: The Fastest Way To Load Pages. Period.
Ezoic announces an industry-first edge content delivery network for websites and creators; bringing the fastest pages on the web to Ezoic publishers.
Launch
Ezoic Unveils New Enterprise Program: Empowering Creators to Scale and Succeed
Ezoic recently announced a higher level designed for publishers that have reached that ultimate stage of growth. See what it means for Ezoic users.
Announcement