
Your Readers Are Worth More Than One Visit. Now You Can See It.


EPMV tells you what a visit is worth. It's never told you what a reader is worth. Those are different numbers, and the gap between them is where a lot of publisher revenue has been sitting unmeasured.
That gap now has a name and a report. User Value (a new set of Lifetime Value, or LTV, reports inside Ezoic's Big Data Analytics, or BDA) is live today for every publisher on the platform, under Behavior → Lifetime Value: LTV Overview and LTV Cohorts.
What User Value actually measures
EPMV answers a single-visit question: what did this session earn? User Value answers a longer one: what does this reader generate across their entire relationship with your site, starting from their first visit?
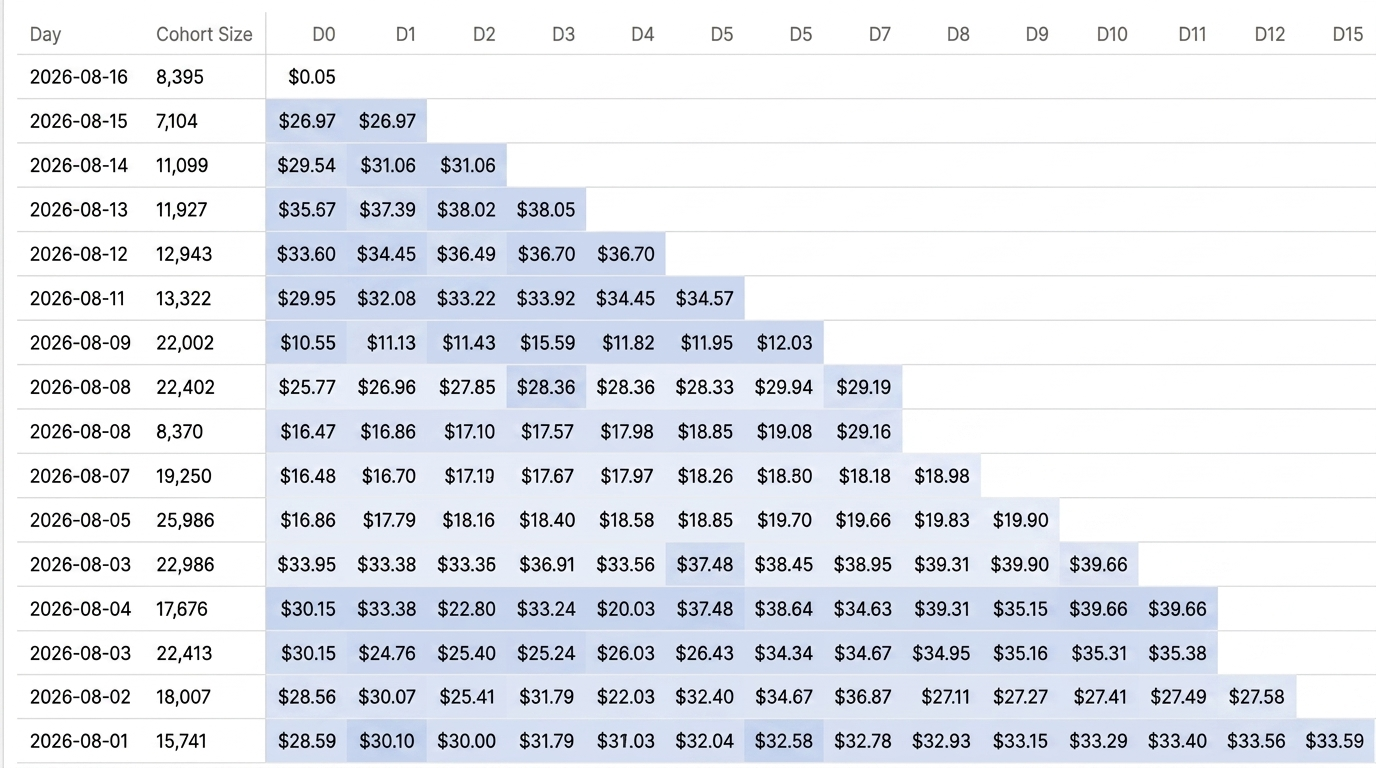
That distinction matters because a first visit is only the start of a reader's relationship with your site. Readers come back to check a follow-up story, revisit a recipe, or compare prices again next month, and every return visit adds to a running total that a per-visit metric was never built to capture. The LTV Cohorts report tracks that total directly: cumulative revenue per 1,000 users, plotted by days since first visit, so you can watch the value of a group of readers compound over time instead of resetting to zero every session.
Two reports, two jobs
LTV Overview is the big-picture snapshot: your audience's lifetime value summed up at a glance. It's the headline number, what your users are worth beyond the visit that brought them in.
LTV Cohorts is the time-lapse view. It groups users by when they first showed up on your site and follows each group forward, tracking cumulative revenue per 1,000 users as the days pass. Instead of one blended average across your whole audience, you get a wave-by-wave read on how quickly each group of new readers becomes valuable, and whether the audience you're attracting this month is more valuable than the one you attracted last month.
If you're new to the term, a cohort is just a group of users who share a starting point, like everyone who first visited during the same week. Cohort analysis follows that group forward instead of folding them into one site-wide average, which is what makes it possible to see momentum instead of a static number.
Key differences between the two reports: Overview tells you what your audience is worth. Cohorts shows you how that value builds, wave by wave.
Why this changes the math on your audience
Mobile apps and SaaS companies have run on lifetime-value math for years. A coffee shop gives away a free latte because it knows a loyal customer is worth far more than that one cup. Publishers haven't had the data to run that same math, because per-visit metrics don't show what a reader is worth over months of return visits. User Value gives you that number.
The practical shift is in how you make decisions. Acquisition spend doesn't need to pay for itself on visit one if you can see the cumulative value a reader builds over the following weeks. Content and retention decisions get easier to prioritize when you can measure which topics or formats actually bring readers back, rather than guessing from a single-visit number. And you get a real dollar figure for what audience loyalty is worth.
Why Ezoic can show you this
User Value runs on Ezoic's ability to identify and follow individual users across visits, identity infrastructure that most monetization partners simply don't have. Per-visit metrics are commoditized; nearly every ad platform can hand you an EPMV number. Per-user lifetime measurement requires knowing it's the same reader coming back, and that's a harder problem to solve for.
That same identity layer is what makes User Value possible. It's also what makes it compound over time. The longer you're on the platform watching your user value curves build week over week, the more history you have to benchmark against, your own audience's trajectory rather than an industry average.
One note on the scope: User Value runs on Ezoic monetization data, so it reflects the audience you're building on the platform specifically.
Where this is headed
Tracking for User Value began July 15, 2026, so what's live today is the foundation. As data accrues, the roadmap adds weekly and monthly views and an overall estimated lifetime value figure, giving you a fuller picture of what your audience is worth as the reports mature.
The reasoning behind building this is simple. "What did I earn per visit today" was never the full story for any business that depends on readers coming back. Real businesses run on lifetime value. This is Ezoic bringing that same standard to web publishing and aligning the incentive on both sides around one goal: building audiences that keep coming back.
See it for yourself
Both reports are live now in BDA under Behavior → Lifetime Value:
- LTV Overview: what your audience is worth
- LTV Cohorts: how that value builds, wave by wave
Pull up your cohorts and watch the curve. That's your audience compounding in real time.