Why Website Ad Revenue Goes Up or Down (EPMV and RPS)
Website Ad Revenue Down? Want it To Go Up?
I see daily questions and posts from digital publishers of all shapes and sizes wondering why their website ad revenue is up — and more typically — down _(this is certainly what leads to more investigations)_. Even if a site isn’t trying to diagnose the cause of an increase or decrease in revenue, most still want to know what they could be doing to increase the revenue they receive from advertisers on their website(s).
I’ll focus on identifying _**EXACTLY WHY**_ website revenue is going up or down on any specific site. Below, you can see how many factors impact EPMV and why increases or decreases in average earnings per thousand visitors (EPMV / RPS) are almost always unique to a site’s particular audience.
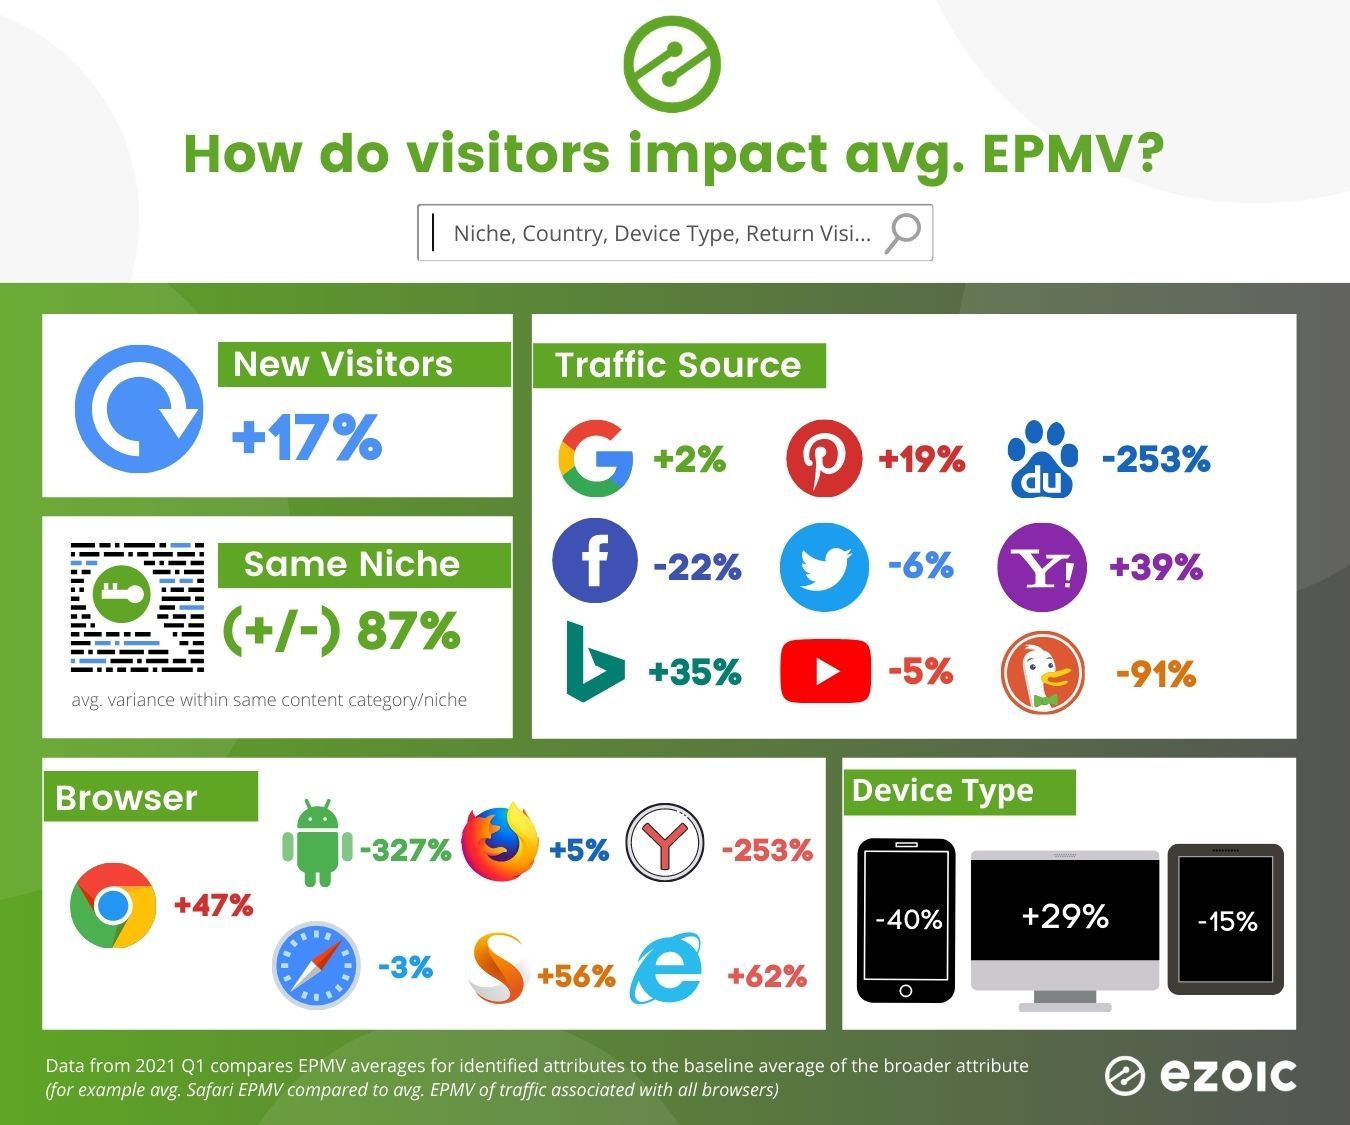
_The above graphic showcases the percentage increase or decrease of any given attribute compared to the average of the parent attribute (i.e. browsers) on 10,000+ sites from January 2021 through March 2021 with outliers removed._
Often, a lot of credit is given to a site’s content niche or category — or even the geographical origin of visitors — as the factor for what an average revenue per visitor will be. Those factors do matter, but are only a handful of over a dozen universally meaningful elements sites should pay attention to. In many cases, too much credit is given to these factors as **some niche content can vary in EPMV alone on the same site by over 1000%.**
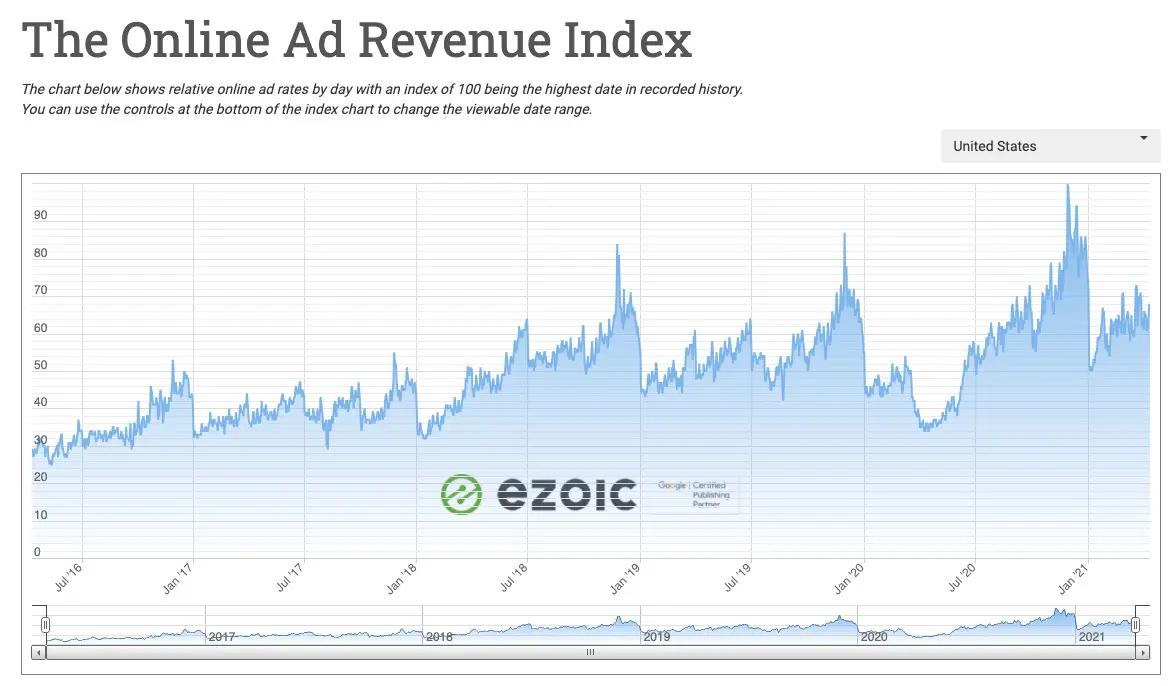
We also famously are the stewards of the Ad Revenue Index ([view it here](https://adrevenueindex.ezoic.com/)) which shows an index score of how ad rates are trending globally by geographical location.
Without exception, I’ll show anyone how they can identify the specific reasons for changes in EPMV (earnings per thousand visitors) _aka RPS_ (revenue per session) over any given time period.
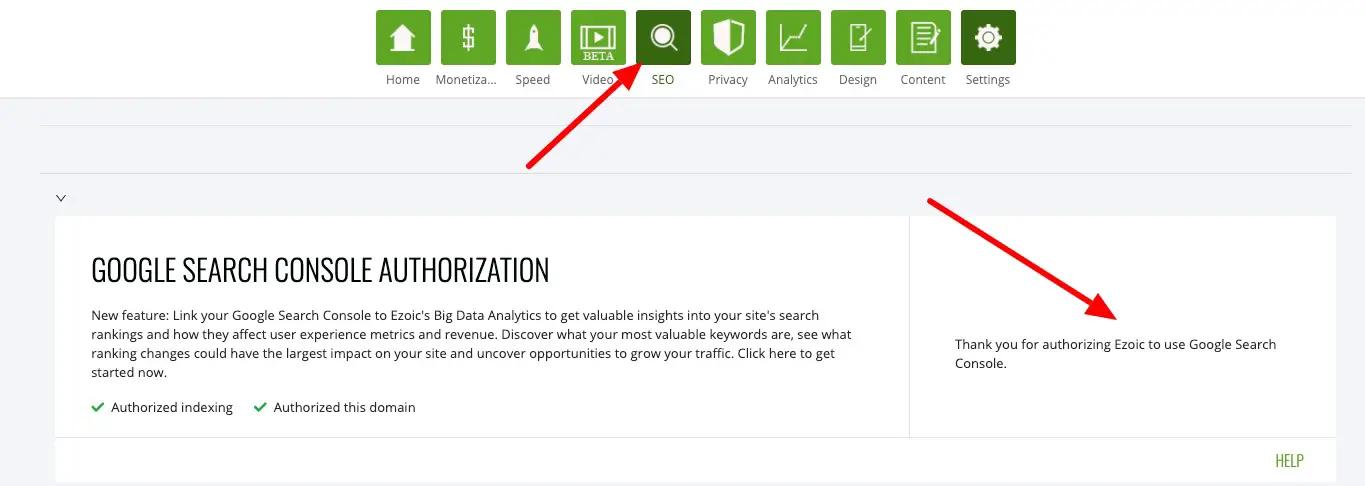
> NOTE: In my examples, I’ll be using Ezoic’s Big Data Analytics; however, sites can still use Google Analytics or Search Console data to measure this but it may take a lot of math to calculate the respective EPMVs for the data we’ll be looking at (which is a core benefit of [using Ezoic’s Big Data Analytics here](/?page_id=1761)).
Confirming changes in revenue per visitor
The first thing sites should do is confirm an actual drop in [revenue per visitor](https://www.thedrum.com/industryinsights/2018/02/13/the-publishing-industry-finally-adopting-epmv-or-session-revenue-and-it) (EPMV/RPS). Lower monthly/weekly/daily revenue is subject to fluctuations in traffic, thus a poor metric for determining if a site is making more or less money from their traffic.
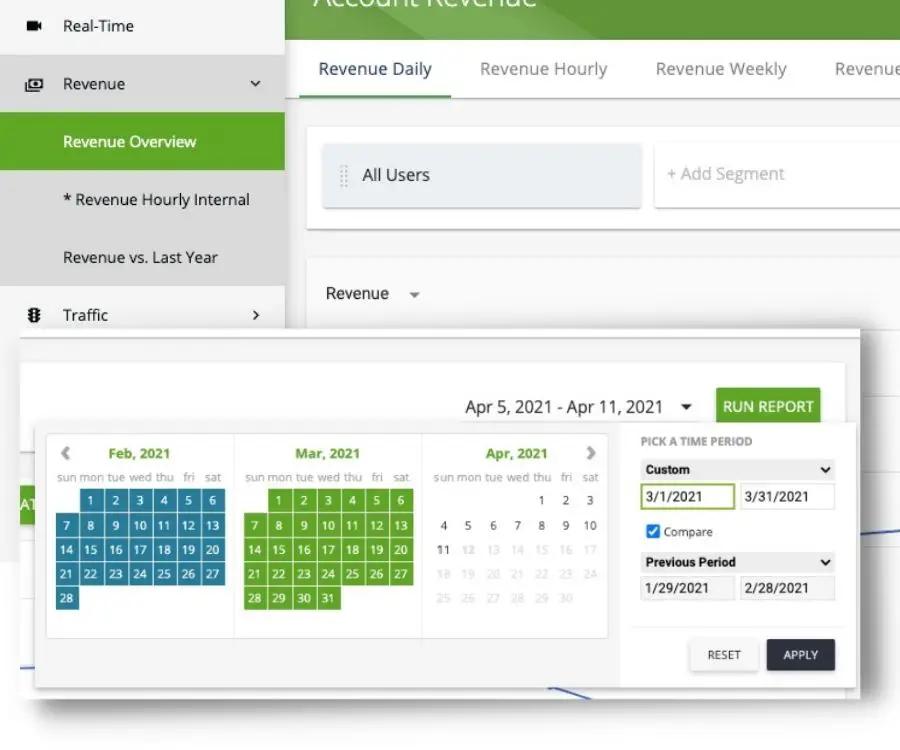
This can be done using comparison periods in Big Data Analytics.
- Use the [revenue tab in Big Data Analytics](https://analytics.ezoic.com/reports/revenue/revenueDaily)
- Select a date range and compare vs. previous or last year (if available)
- “Run Report”
This should allow you to see the exact percentage that EPMV or RPS is down or up on your entire site in the selected period vs. the same days before the selected date range.
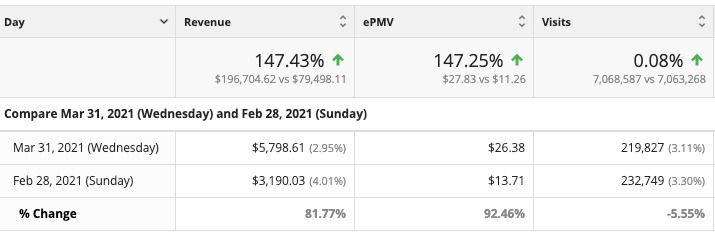
From here, you should be able to identify if your suspicions are correct or not. Keep in mind that [ad rates fluctuate](/?p=10289) at the end of the year (start of January), end of the quarter (end of March, July, September), and typically rise the highest in Q4 (October- December — advertisers are increasing spending for the holidays).
> Seeing a decrease of 15-25% in a site’s EPMV is not uncommon when [comparing January to a month like December for example](/?p=330147).
Identifying the sources of higher or lower ad earnings
If you confirm that a site’s EPMV is higher or lower within the range you are analyzing, then you can start looking a bit deeper at specific attributes to see why.
In many cases, sites will see their average EPMV change when traffic changes. If visits/sessions increase — but increase in areas that earn a lower EPMV — then the average EPMV will likely decrease. It doesn’t mean that certain web traffic is bad, or should be avoided, it’s just the source of a decline in average EPMV. Receiving traffic from specific platforms, devices, or audiences with lower ad rates doesn’t typically have any impact on the ad rates for higher-earning forms of traffic.
Device Type EPMV
Understanding if increases or decreases are due to a higher or lower volume of traffic by device type can begin telling you a bit more about the dynamics of your EPMV changes.
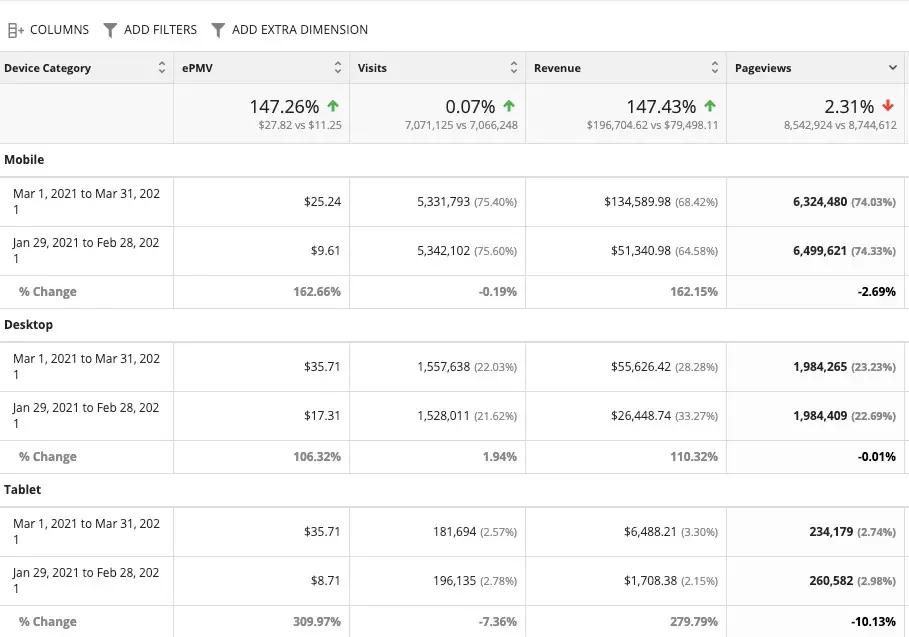
**In Big Data Analytics:**
- Compare date a range like we did above
- Select the Technology tab, [then Device](https://analytics.ezoic.com/reports/technology/device/deviceType)
- Drag and drop columns to examine EPMV, traffic, revenue, and more
Traditionally, desktop traffic will be higher earning than mobile. This isn’t always true and higher mobile traffic can occur for many reasons (see below); however, major differences could be the result of fewer mobile placeholders (if using Ezoic) or flaws in the way those pages display info to visitors (see landing pages).
Content EPMV (SEO, Landing Page, Category)
Content is what attracts your audience. What many sites don’t realize is that different content on their own site can vary exponentially page to page.
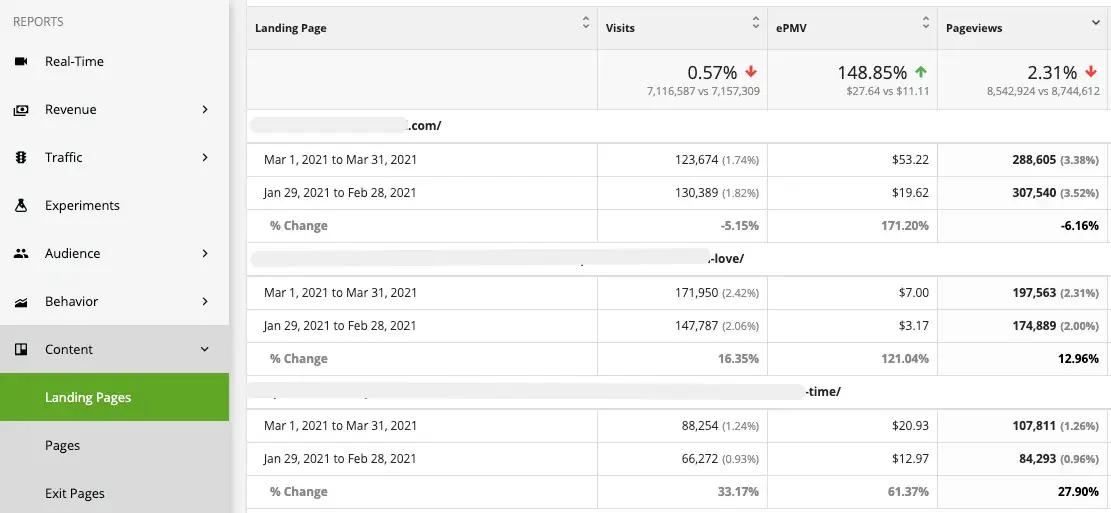
Sites can see what content visitors come to as a landing page that produces the highest EPMV in this range, and how much it may have changed.
- Compare date range
- Content tab, then [Landing Page](https://analytics.ezoic.com/reports/content/landingPages)
- Drag and drop columns and sort pages according to criteria you find important
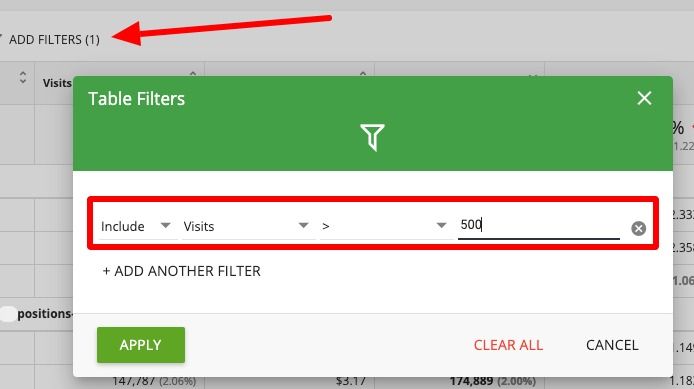
Sites can also filter the pages to view only pages receiving significant pageviews or visits to reduce outliers making the data hard to interpret.
- Above the columns, select “add filters”
- Select “Include”, then “visits”, and enter a relevant qualifier for your site and date range
- Apply the filter and examine the results for pages receiving at least that many visits
Landing page EPMV can vary dramatically on the same site. For example, the page above shows two Landing Pages with significant traffic with EPMVs that differ by a factor of +10.
**The above site has:**
- 1 landing page with a $53 EPMV
- 1 landing page with a $7 EPMV
- 1 landing page with a $20 EPMV
If you wonder why a site’s EPMV is up or down, you can see just how nuanced this question gets when you look at the major differences on a site’s own pages.
The reason for changes in landing page traffic or EPMV could be directly related to the intent of the visitor. A page may have previously seen the majority of traffic from one specific query from Google Search. Over time, the page may begin to rank for related terms as well that actually results in more visitors that avg. a higher or lower EPMV.
Advertisers bid on visitors coming to the same page from various queries differently. This is best examined by connecting Search Console data to Big Data Analytics.
Having this info will allow you to compare earnings from traffic originating from Google Search dependant on queries, pages, rankings, and more. This allows sites a better way of quantifying SEO efforts as well (for example, does an increase in rankings help/hurt EPMV for a query).
- Compare date range
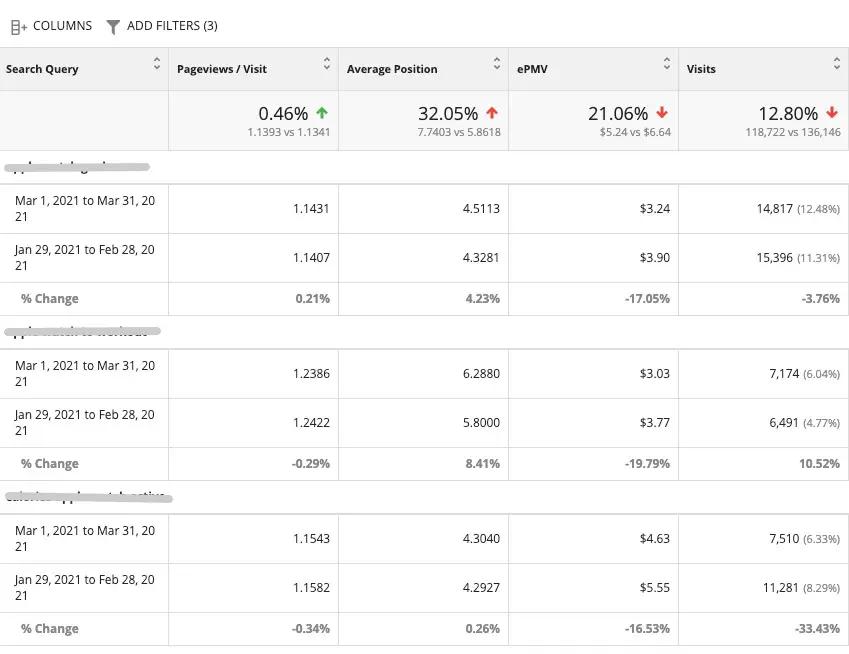
- SEO tab, then [select “Search Console”](https://analytics.ezoic.com/reports/seo/searchConsole) (be patient if you just connected it the data may take a while to accrue)
- Drag and drop columns to examine the impact
> You can also run filters that include a keyword to see how different types of queries for the same keyword affect the EPMV. For example, is “how-to” content generating a higher EPMV than “what is” content for queries involving the exact same keyword?
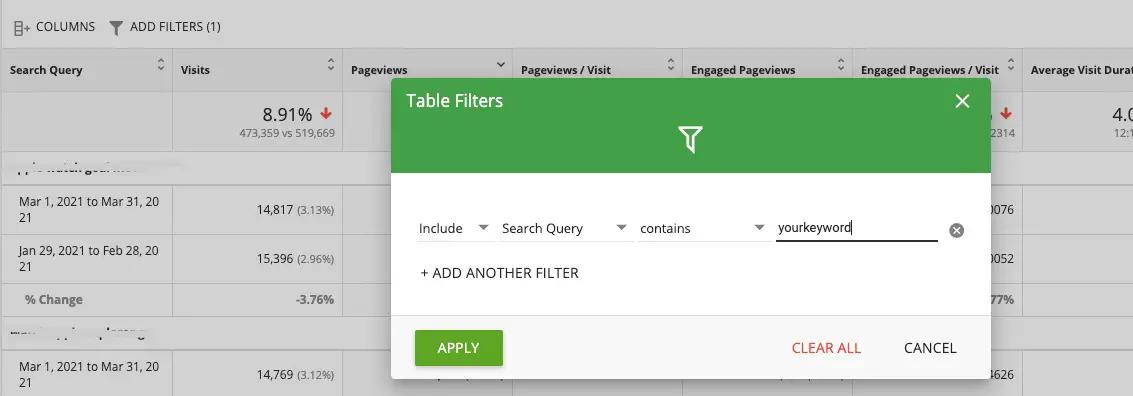
- Select “ad filter” above the columns
- Select “queries”, then “includes” \[insert a single keyword here\]
- Then sort by EPMV to see the highest-earning queries for the same keyword
This will allow you to better identify the types of content for different queries related to the content on your site with higher earning EPMV. It will also allow you to see just how impactful changes in the position the content ranks in Google Search is to a keyword’s EPMV.
The category of content
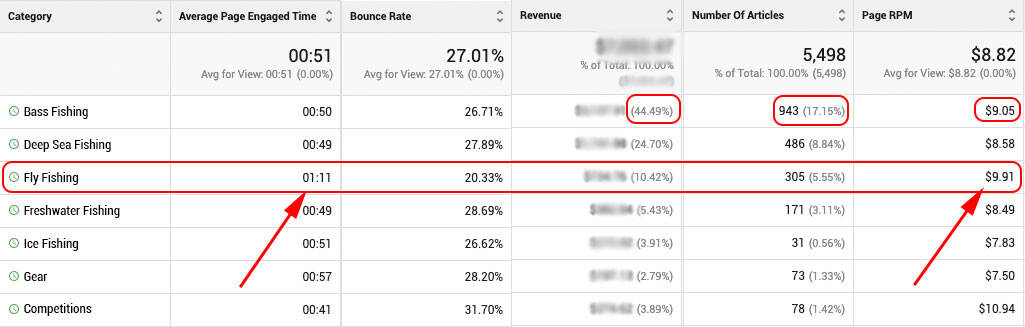
Sites that have properly [classified content categories according to open web standards](https://support.ezoic.com/kb/article/how-does-ezoic-pull-information-for-article-content-reports-in-big-data-analytics?id=how-does-ezoic-pull-information-for-article-content-reports-in-big-data-analytics&lang=en-US) will also be able to dig further into how they classify their content to identify the highest-earning forms of content according to their own criteria. This is something [covered in a detailed article about content categories here](/?p=12278).
**Access this by…**
- Content tab, then [select “Categories”](https://analytics.ezoic.com/reports/content/articleCategories)
- Feel free to use filters to remove uncategorized or undefined categories
- Add filter above columns, then exclude “categories” “containing” \[insert your excluded category here\]
Looking at traffic “source”
Last, we’ll look at traffic sources. If a site starts to see an increase in non-Google Search traffic, the Search Console report may be of little use; however, it may be a lower quality traffic source driving down EPMV, or a higher-earning traffic source lifting it up.
Combining insights from traffic source reports and other reports above, sites should be able to pinpoint the direct actions or causes that produce changes in average EPMV as a result of particular types of traffic (i.e. mobile visitors coming from Facebook).
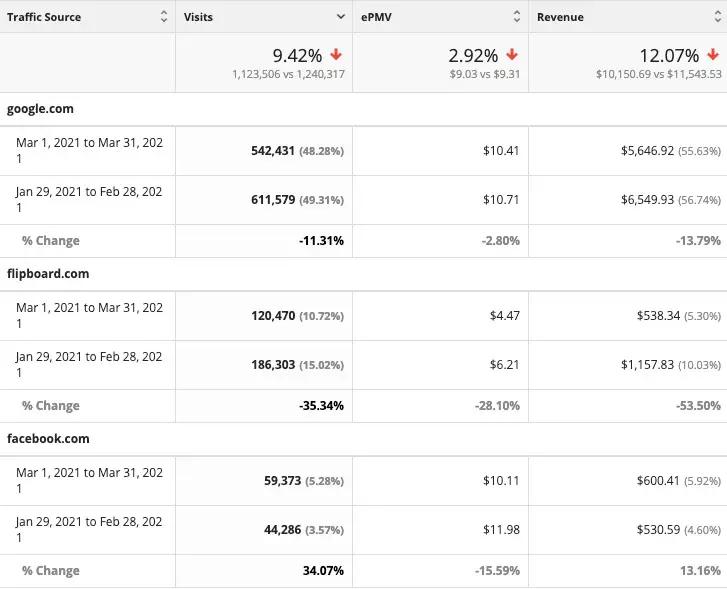
- Select the Traffic Sources tab, [then “Traffic Source”](https://analytics.ezoic.com/reports/trafficSources/trafficSource)
- You can add a filter like we did above to exclude “unknown” traffic sources
- From here you can also add extra dimensions, like “browser” or “country” as well
- Select “Add Extra Dimension” above the table in the report and pick your criteria
Accounting for changes in the geographical source of traffic
Sites may want to look at the impact of traffic source location independently or as a part of their traffic source. As you can see in the example below, there is a much more granular level of insight achieved by combining geo-location attributes with other attributes, as the source and the geo can account for pretty wide variances in overall average EPMV.
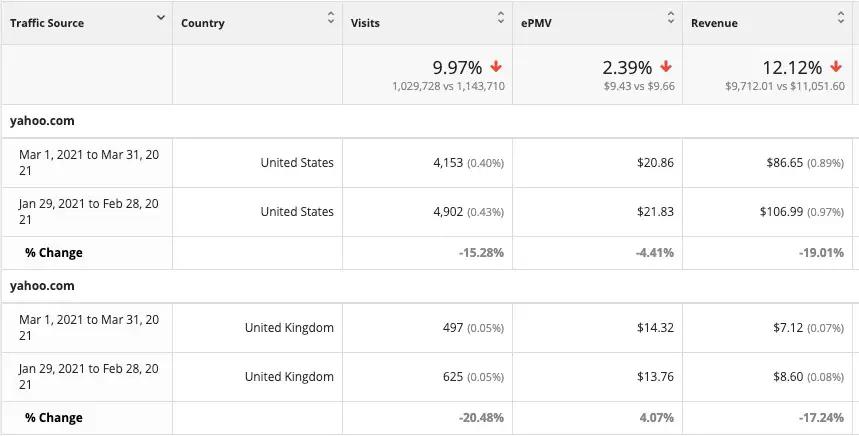
- Select “Country” after adding an extra dimension in the traffic sources report
- Use filters to eliminate sources with a low number of visits and other relevant criteria
Every site is unique so EPMV is different for each site
These are just some of the most common variables that impact changes in overall EPMV. Every site should explore other factors that may prove to be meaningful on their particular site.
Sites can use Ezoic Big Data Analytics to research some of these other popular attributes as well…
1. [Request Time](https://analytics.ezoic.com/reports/speed/timing/requestTiming)
2. [Framework](https://analytics.ezoic.com/reports/technology/framework)
3. [Core Web Vitals](https://analytics.ezoic.com/reports/speed/coreWebVitals)
4. [User Engagement](https://analytics.ezoic.com/reports/ux/trafficSourceUX)
5. … and much more
> Sites will typically find that comparing their site to another site that they assume is similar to be totally unhelpful after reviewing this data; as there are dozens of ways to splice up why a site earns a particular EPMV.
>
> For example, the site used for most of these examples has a 20% lower avg. EPMV than another site that has an almost identical domain name and covers the same topic. Both receive the majority of their traffic from the U.S. and achieve close to 3 million pageviews per month.
While many may think criteria like audience location and content niche/category are paramount, the data shows that these are very broad categorizations and subject to a large number of factors and caveats.
I hope this has helped in navigating your site’s EPMV.