

How Do I Put Ads On My Site That Increase In Value?

**How Do I Put Ads On My Site That Increase In Value?**
Most website owners or brands who choose to monetize their sites through display ads want to know how to get the most value out of them. Or better yet, they would love for ads on their site to _**increase in value over time**__._ But, what determines if the value of the ads goes up or down?
Despite all the information we put out on [how programmatic advertising works](/?p=5739), this remains a major mystery to most publishers. And in the defense of publishers, the digital ecosystem is [increasingly complex and constantly changing](/?p=6776).
Today, I’m going to walk you through the ins and outs of how to monetize your site with ads that actually increase in value over time. Using real data from Ezoic’s Big Data Analytics, **I’ll show you what makes ad rates go up or down on your website.**
**What is responsible for increasing ad value?**
To begin testing and measuring ad value, you need to start thinking of the dynamic between website ads, visitor experiences, and [the value of ad inventory to advertisers](/?p=11909).
Are all ads bad for user experience? No, and the reason why is because _**all visitors to a site behave differently**__._
Are ads on your site increasing in value? Also, no. **Some ads decrease in value and cause your entire site to make less money over time.** Why? advertisers don’t want to pay for ads that people are ignoring or not engaging with.
**Which ads are causing bad experiences and lower ad rates then?**
It’s different for everyone, but there are some core things that we know impact this…
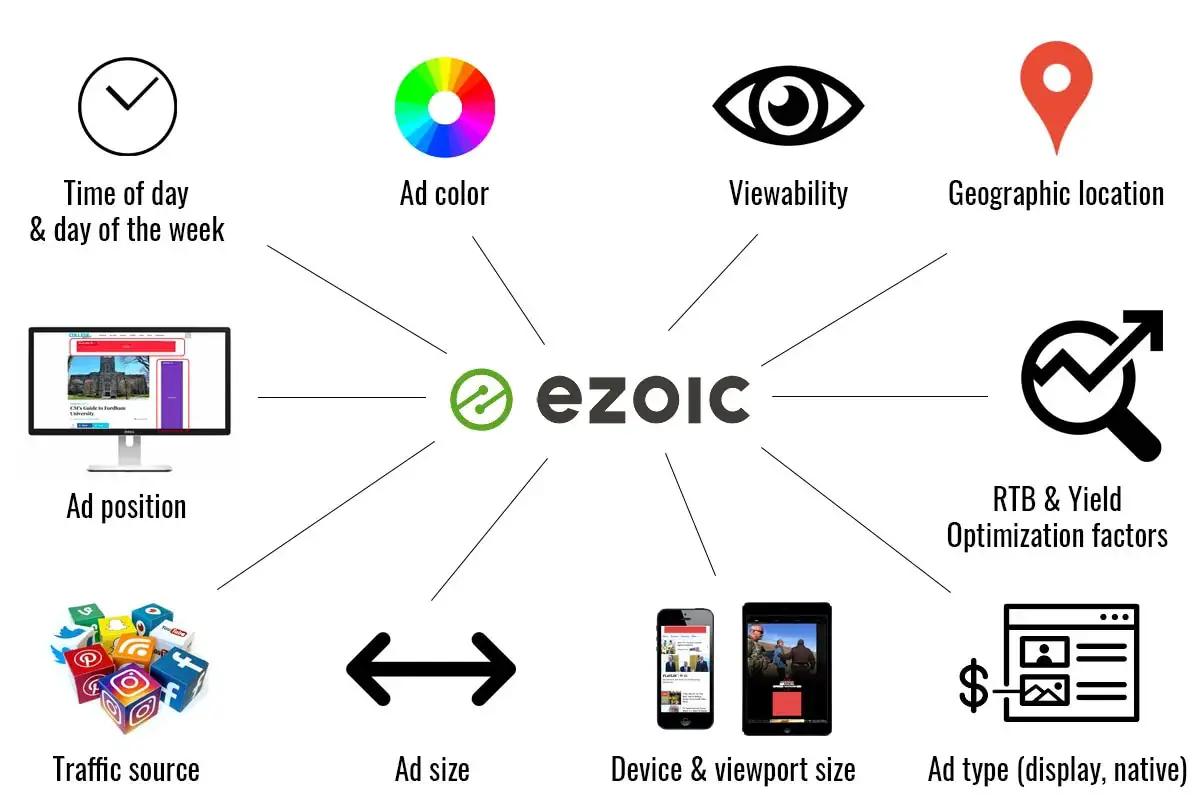
**Visitor behavior and attributes like…**
- time of day they visit
- day of the week they visit
- traffic source
- device type
- scroll depth
- geographic location
- and other behavior
**Ad attributes like…**
- ad color
- ad size
- ad type
- ad location
- ad density
- … and ads per page, per pageview
In the case study below, we have _**a site that adjusted all of these things and saw a significant uplift in ad revenue**_; while increasing the overall value of all of their ad rates. This site happened to be using Ezoic to adjust and manage some of the attributes displayed below.
The intersection between UX and increasing revenue is based on the principle that **[visitor experiences and ad earnings are directly correlated](/?p=9420).**
Additionally, the principle of supply-and-demand comes into effect when we start looking at **how ads impact the way that advertisers adjust their bids over time**. In some cases, ads might dilute each other, in others they may provide a higher value to advertisers when shown in different combinations on certain pages.
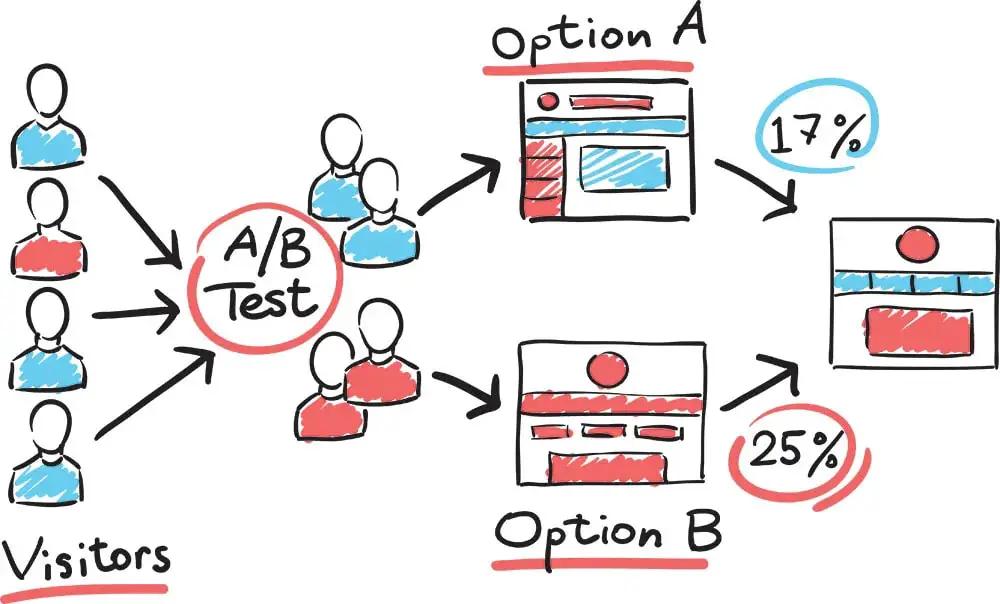
Testing is the best way to understand this on a website.
But, A/B testing is flawed. An experience that works for 75% of the audience might be terrible for the other 25%.
Do you give people that preferred option B a different option simply because they were in the minority? No. We should segment visitors and deliver something different to everyone based on test results. [A/B testing has the potential to lower your ad revenues over time if you’re not careful in how you implement test results.](/?p=10521)
So, how do we avoid that? Let’s look at a real-world case study to find out…
**What impacts website ad yield?**
I’m going to show you the yield data for this site’s **demand partners, ad locations, ad placements, ad sizes, and ads per page**. This data gives you the most granular look into what changes are responsible for when ad values or ad rates increases on a publisher’s website.
**Comparison timeframe of the data:** July 2nd – Aug. 5th vs. March 20 – May 6
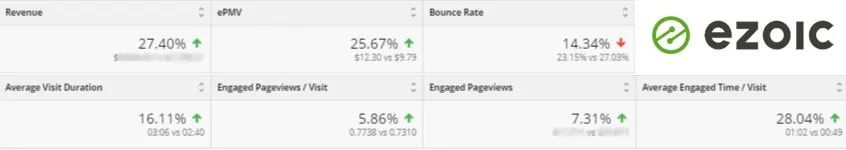
**UX and Revenue results:**
- Bounce rate improved: 14.34%
- Revenue: +27.4%
- EPMV: +25.67%
- Avg. visit duration: +16.11%
- Pageviews per visit: +1%
- Avg. Engaged time per visit: 28.04%
- Engaged pageviews per visit: +5.86%
**How important are ad demand partners?**
In the world of ad demand partners, publishers often wonder if they’re getting the most juice out of the metaphorical fruits that are different demand partners. In reality, Google [wins the A LOT of bids](/?p=11545). Once a publisher has access to a handful of header bidding partners and Google AdX, the benefit of adding demand partners decreases exponentially.
Additionally, having more demand partners is becoming even less relevant now than in the past because of Google moving to [a first-price auction in Google Ad Manager](/?p=6776).
> Header bidders, or other demand sources may be beating Google AdX in 5% of bids but they often only win by only 5% or less of the total bid amount. This means that it only increases 5% of the revenue by a very, very small amount (5% or less).
**So, 5% improved by less than 5%**
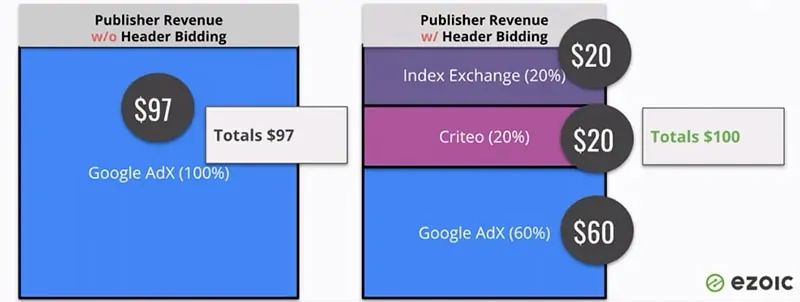
You can see in the simple example above how having multiple demand partners increases revenue by around 3%. Over time, for that 3%, there is a myriad of things you’d have to manage from each ad demand partner.
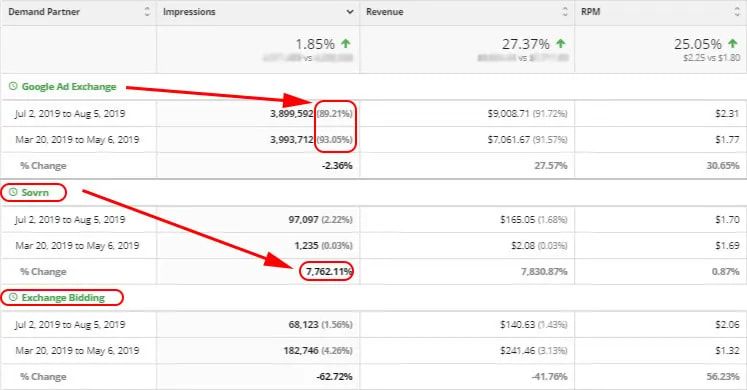
> Either way, when we see the +25% revenue increase above, we can now look below and clearly see that ad network, header bidding, and ad exchange changes or shifts had little to do with the increases in ad rates when looking at the screenshot below…
**Which “ad networks” or ad partners are worth it?**
Ad demand partners can essentially be lumped into 3 categories; ad networks, ad exchanges, and direct/private deals. These demand sources vary in type and function. This is a bit of a simplification, but for the sake of making things easy, this is how we can think of it.
- **Ad Networks:** There are thousands of these (AdSense being the biggest, and others like Media.net, Propeller Ads, etc.)
- **Ad Exchanges:** There are less than a dozen or so of relevant ones (Google’s AdExchange, AppNexus, OpenX,)
- **Direct/Private Deals:** These are advertisers that work directly with publishers to advertise on their sites (through direct relationships or programmatic private marketed places \[a PMP deal\], etc. etc. etc.)
This publisher was using Ezoic, so all these demand partners were available instantly and compete against each other alongside any existing partners they chose to include. In this case, we can clearly see that Google AdX is accounting for the vast majority of their revenue.
This is why [you should be wary of outsourced ad ops shops, ad networks, or demand partners](/?p=12083) who claim to have a magic setup to make you more money.
**How does ad density impact ad value?**
Ads per page is one of biggest elements that publishers tend to get confused over.
[How many ads is too many ads](/?p=6340) and how many should I show? Is it 6 ads, or 7? or maybe 9? Let’s take a look at the publisher’s data below.
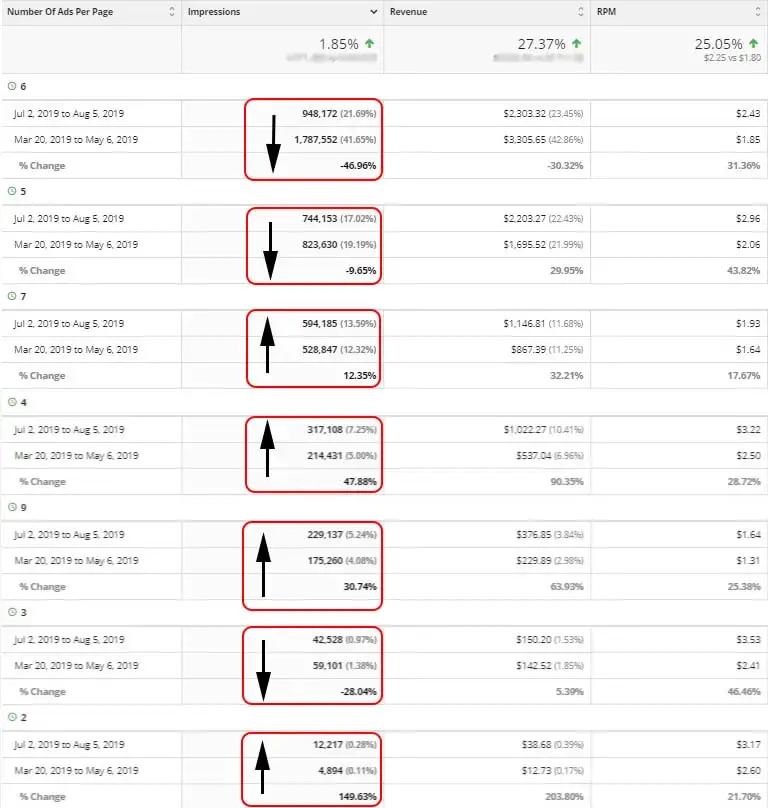
> In this case, Ezoic automatically adjusted this based on how it noticed users responded and advertisers were bidding over an extended period of time.
>
> Ezoic started showing fewer of 6, 5, and 3 ads per page, yet ironically, with showing 5 and 3 to fewer visitors, the **revenue is still increasing**. We see increases in 7, 4, 9, and 2 ads per page. **The largest increases in impressions are with 2 and 4.** This seems counterintuitive compared to some adtech and ad-ops methods of jamming as many ads on the page as possible to show or display higher “RPMs”.
**Advertisers may bid very low for an ad at the bottom of a page that is rarely seen or clicked by the majority of users. Removing that ad will cause RPMs to drop initially; however, over time those advertisers will begin increasing bids to start getting the NOW LIMITED ads at the top of the page. This means higher ad rates for the ads at the top and more competition for them — THIS MEANS THEY INCREASE IN VALUE!**
More money, fewer ads.
Additionally, with a click of a button, advertisers can remove their ads from populating on your site. If you show too many low-value ads to visitors, advertisers will stop participating on your site.
The trick is knowing which ads are adding value and which ones aren’t.
**How does ad location affect ad value over time?**
The big issue with ad testing is that it’s **different for every user**. Some want to engage right away with the site, get their information and leave. Others want to scroll deeper within the content, navigate through the site, and view multiple pages.
Getting ads in better positions over time means that visitor engagement improves, and so does the traffic quality from an advertiser’s perspective.
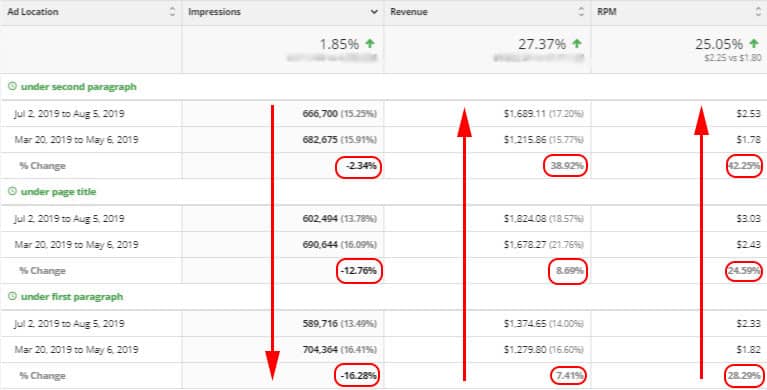
> We can see from the data above that there are big changes in ads shown above the fold (which are generally considered the highest viewable ads locations). [Ezoic’s Ad Tester](/?page_id=1148) shows all of these less frequently, so they are decreasing. Though these above the fold ads are being shown less, Revenue and Page RPM **are still seeing large increases**. This might be because when these are being shown, it is resulting in a better outcome for the advertiser or the ads dilute eachother less in these circumstances.
**Let’s break down the rest of the data from this publisher.**
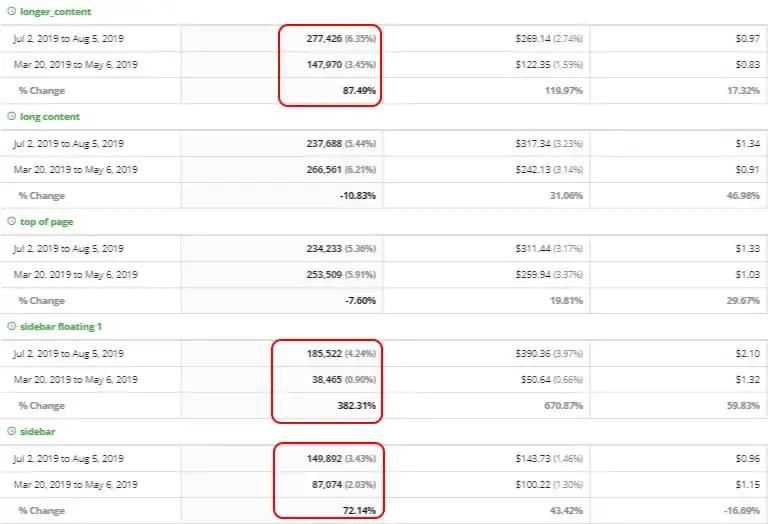
- **Ads deeper in content:** We see more content being shown lower in content. Sidebar ads see a massive increase. Understanding how ads might impact each other is important; as seeing where you can spread ads out might offer value in increasing overall ad rates.
- **Above the fold ads**: Under first paragraph, top of page, and under page title are not being shown as often, but you can see that revenue and RPM are still increasing. In-content ads are being shown more and contribute to a 119% increase in revenue and 17.32% RPM. Many times these are the first ones publishers will try to exclude because they don’t want ads in content, but often this is where they are least intrusive and less likely to dilute the value of other ads.
- **Scroll percentage:** Understanding what visitors are most likely to see and engage with gives you better bets on which ones might prove the most valuable to certain users and advertisers**.** This leads to higher viewability and sometimes higher page RPM.
**How does ad size impact ad rates?**
This publisher’s data can better explain some of the nuances that exist with ad size in relation to overall site revenue.
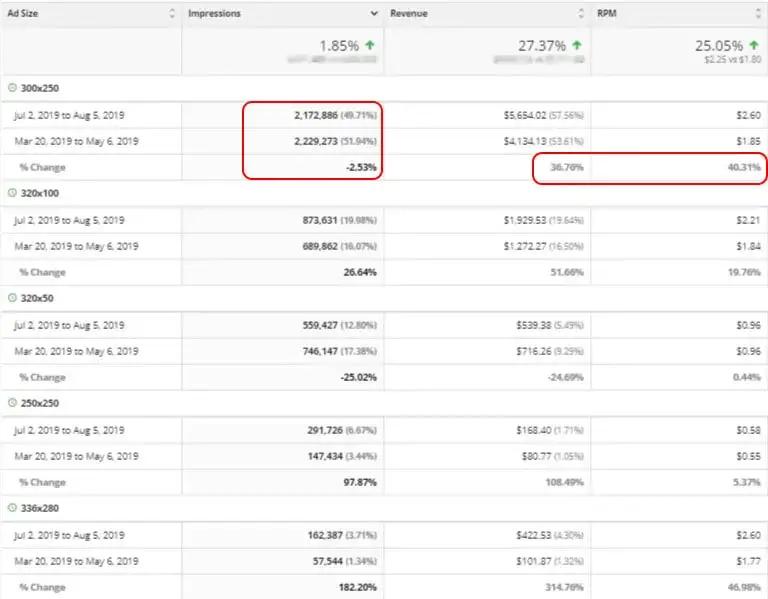
We can see above that the most frequent ad size on the site, 300×250, decreased by 2.53%. Yet the revenue and RPMs from this ad size increased by 36.76% and 40.31% respectively.
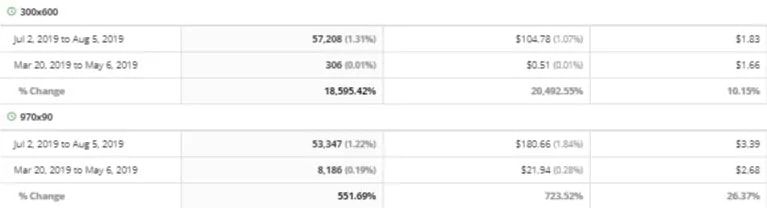
With 300×600 and 970×90, Ezoic’s Ad Tester made other adjustments that yielded positive results as well.
> Certain sizes may actually dilute the value of other sizes on the page. Finding a combination of sizes that maximizes value is key when testing ads.
**Can segmenting visitors impact ad performance?**
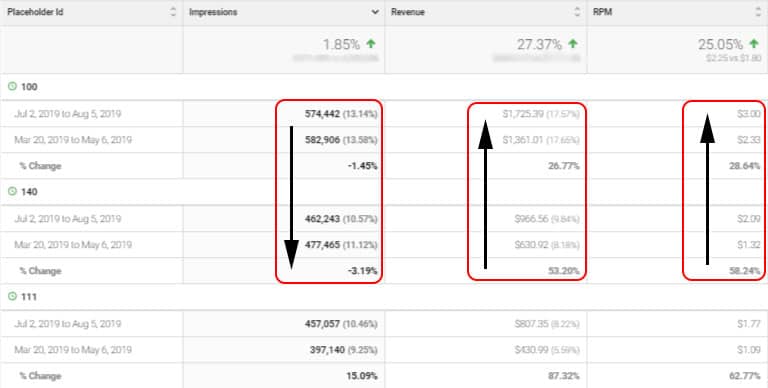
With Ezoic, ad placeholders are used so that Ezoic can manipulate ad density and ad placements on a per visitor basis.
We can see above that the two top placeholders (100 and 140) have actually been shown to visitors less, yet the revenue and RPMs are increasing. This is happening for the exact same reasons as in previous sections—the machines are testing thousands of different combinations of ad placeholders to attempt to strike the balance of UX and revenue growth.
UX, revenue, viewability, and scroll depth are just a few individual elements that are tested and accounted for as different placeholders are used or neglected when displayed to different visitors.
**Wrapping it all up…**
What’s the takeaway? The data from previous visitor sessions affect future decisions being made by advertisers that bid on your website’s ads. Changes you make today will not impact revenue immediately but have the potential to increase or decrease ad value in the future.
The more visitors to your site, the more data you’re going to have on this, but it is also more to dig through, test, and change.
Showing you this behind the scenes ad yield data was meant to serve the purpose of providing some insights into what elements are actually responsible for improvements or changes in ad earnings or ad rates on your website.
Do you have questions on how this works? I’ll try to answer in the comments below.