UX Metrics That Are Changing How We View Visitors
UX Metrics That Are Changing How We View Website Visitors

Objectively looking at User Experience Metrics
I’ve [talked about this a bit before](https://blog.ezoic.com/website-usability-testing-actually-works/) but there are really 3 types of ways that user experiences are being measured today on a macro-level.
1. **Objective Data**
2. **Subjective Data**
3. **Objective Data with Subjective Analysis**
> I once worked with a large site that heat mapped their site for a month. When they were done, they **KNEW** that people weren’t clicking on their drop down menu because of the way it was ordered. Ultimately, they decided to rebuild the site and then place the most “important” navigation elements in the areas that the heat maps revealed as the places that users were clicking. The result? That site saw bounce rate rise considerably and session duration plummet. **Their entire website redesign hurt their SEO badly for about 6 months.**
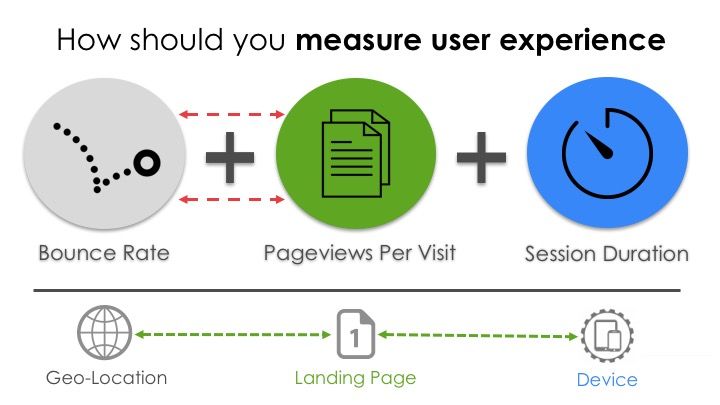
What can we learn from objective UX data?
I really don’t want to rehash or regurgitate the really great articles I’ve written about this before, but I do think there are some things I may have not covered yet on this topic. If you haven’t read the two articles below, I strongly suggest you do (as they strongly relate to this topic).
- [How UX affects digital monetization](https://blog.ezoic.com/how-ux-massively-influences-website-revenue/)
- [Why do landing pages and user journeys matter so much…](https://blog.ezoic.com/balancing-user-experience-digital-ad-revenue/)
The next generation of UX metrics
Tracking Advanced UX Metrics
As we’ve learned throughout digital publishing history, those that game the system are destined to pay a price, but those that invest in their users and their actual experience usual benefit greatly from these efforts.
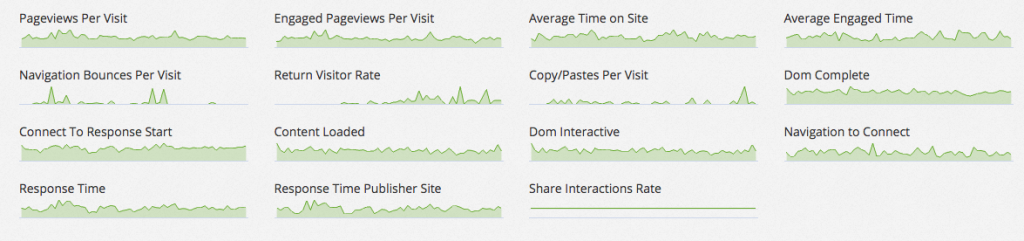
Below are some core _**intent metrics**_ that publishers should be making themselves familiar with. Our data science team has recently started tracking these across thousands of sites, and are starting to notice some **strong correlations between improvements in these metrics and higher revenues and more traffic**.
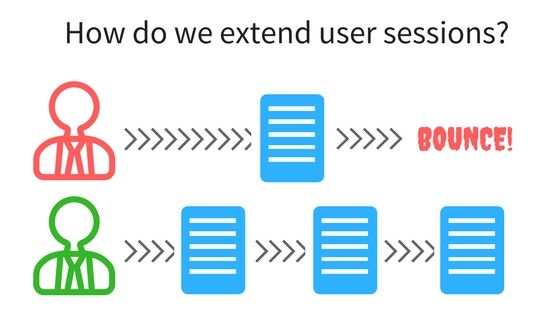
Navigation bounces
This might be one of the most important “intent” UX metrics to keep an eye on. There are a lot of ways that pageviews per visit can be manipulated. Google and the alike have been keen to these for years. Employing methods of securing more pageviews associated with quick navigation bounces **can be deadly for SEO and ultimately revenue**.
What is it exactly? Navigation bounces are similar in a regular bounce where it tracks a user exiting quickly, but is more targeted. A navigation bounce tracks bounces over different pageviews. Say we have 3 pageviews: A, B, and C – where A and C are the same page. The user starts at pageview A, clicks a link to pageview B, realizes the link was incorrect, then they go back the original page (pageview C). The pageview that is marked as having a navigation bounce is pageview C.
It is paramount for publishers to identify parts of their site where this might be occurring at a high rate, and why. We are in the process of releasing a fascinating study on this and it’s effect on SEO and revenue.
[Read more about how navigation bounces affect revenue and SEO here.](https://blog.ezoic.com/navigation-bounces-affect-seo-digital-revenue/)
Engaged pageviews per visit
An engaged pageview is a pageview where the user has been spent a reasonable amount of time “engaged” to the page. At Ezoic, we keep track of their engaged time, which is the time they spend reading on a page. A user is not engaged if they are scrolling, not in browser, in a different tab, etc.
This is a fantastic metric to see how users are objectively enjoying your content. It can help you determine how different page changes or other alterations may be truly affecting user experiences.
[This is a very good way to show how **not all pageviews are created equal.**](https://blog.ezoic.com/monitoring-engaged-pageviews-per-visit-offers-major-benefits/)
Return visitor rate
This one is pretty easy to figure out, but really important for any site that has a brand, image, or relies on returning visitors for traffic and growth. Wouldn’t you want to know if a change or something about your site was positively or negatively affecting the rate at which return website visitors returned to your website?
This is a really important one to track if you get more than 10% of traffic from direct sources.
Connect to response start
This is the time between when a connection starts and the time to the first byte. This is important to monitor when you have things on your site that require users to leverage data quickly.
Copy/Paste per page
This is another one that is pretty easy to understand. How much are people copy/pasting from your site? For some, this may not seem like a big deal, but if you’re a site that provides information to searchers or visitors, you would be surprised at how often items are copied and pasted from your site.
It can be really important to understand if something may be negatively affecting this number, and what types of content get the highest rates. This will tell you a lot about how users are accessing and engaging with your content.
Average engaged time
This is pretty simple and ties to the engagement metric above; however, it is a nice overarching way to see if changes or improvements on your site have a positive or negative effect on this metric across your site.
[Read more about average engaged time here.](https://blog.ezoic.com/engagement-time-important-top-publishers/)
Better understanding user experiences
Ultimately, many digital publishers are not fully capturing or taking advantage of traditional UX metrics today. It is certainly a large opportunity and one with major rewards. However, those that are, maybe looking even deeper into understanding and optimizing user behavior.
The new metrics above — and methods of understanding landing pages better — offer some new insights that may prove helpful in tracking these UX metrics. For those interested in the new measuring these UX metrics on their site, it can be done so by using [Ezoic’s advanced reporting](/?page_id=1212).
Questions, thoughts, etc. Leave them below. I respond to everything.