Maximizing Digital Revenue Using Often Neglected Insights

Maximizing Digital Revenue Using Often Neglected Insights

Using Neglected Analytics Data To Maximize Digital Revenue
Some of the data we are about to look at may be data you look at every day; however, I’m going to give you a few new ways to think about in the context of maximizing digital revenue. The other information we’ll look at may be something you aren’t currently tracking.
I use [Ezoic’s Advanced Analytics](/?page_id=1212) (free to join platform) to analyze my own pages on Ask Dave Taylor, so check out _Figure One_, where it shows a series of different URLs organized by Visits, with lots of other data shown too:
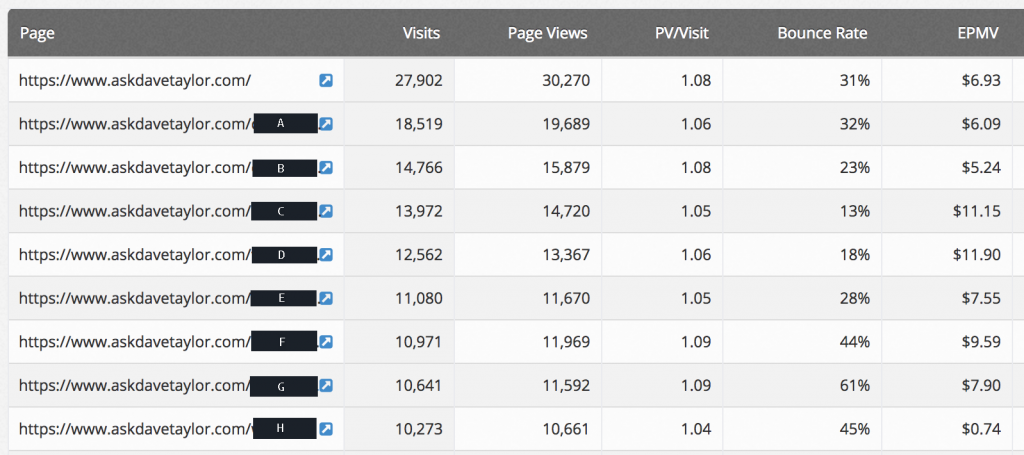
Figure One
EPMV is a true north metric for publishers
The column I pay the most attention to in these reports is EPMV (earnings per thousand visitors) because I’m always trying to ascertain not just which topics are the most interesting, but which are the most profitable from a digital revenue perspective? Why EPMV instead of eCPM or RPM? That’s easy, you can check out this article on why EPMV will always keep you pointed in the right direction while [eCPMs and RPMs could have you making less money](https://blog.ezoic.com/why-ecpm-vs-rpm-is-skewing-true-earnings/) even though those metrics are increasing.
EPMV answers a lot of important questions once you [understand it](https://blog.ezoic.com/balancing-user-experience-digital-ad-revenue/). For example, you can see that page “H” might generate a lot of traffic, but it has almost no revenue, with a pathetic EPMV of $0.74. By contrast, 1000 visitors to “D” will generate $11.90, quite a healthy EPMV.
_Note: Page “H” is some adult oriented content so some of my ad networks refuse to show on that page, which is why its revenue is so miserable._
Landing Pages vs. Pages
Additional ways of normalizing page value
One of the things I personally struggle with is weighing my content based on how much revenue it generates vs. how much traffic it actually receives. How should I approach creating new content if I can’t really determine which is producing the greatest average value?
One way I calculate that is by normalizing EPMV and then multiplying it by total page traffic. For example, page “A” is worth:
19689 \* ( 6.09 / 1000 ) = 119.90
Not bad for a single Web page. Certainly when compared to page “H” which generates plenty of traffic but almost zero revenue (10,661 \* ( 0.74 / 1000) = $7.88). You can easily calculate this for by pulling out the EPMV’s by landing page by yourself from Ezoic reporting then exporting the data into a spreadsheet like Numbers or Excel and apply this particular formula.
What can you do with these insights
Now, armed with your most valuable landing pages and normalized pages (if this is helpful to you) by EPMV, what can you conclude? What topics do your readers really appreciate and stick around to read? And, most importantly, what are you going to be writing about tomorrow?
This information should give you much greater insight into what pages you should actually be driving traffic to and what types of content are really earning you the most digital revenue. This is information every content team and social media team should be used to help contribute to bottom line growth.