For Nerds: A Live View Into the AI Running on Your Site

Most ad tech dashboards show you outputs. Revenue. RPM. Fill rate. A number goes in, a number comes out, and the machine doing the actual work stays invisible. You're asked to trust the system, and if the number looks good, most people do.
That model has a problem. When revenue dips, you don't know why. When a demand partner disappears from your auctions, you don't know what it cost you. When the AI adjusts your floor pricing downward during a soft-demand week, it looks like a regression. Without visibility into the decisions being made on your impressions, every graph is just a readout from a black box.
For Nerds inverts that. It’s a publisher-facing dashboard, live for all Ezoic publishers since April 2026, that shows you exactly what Ezoic’s AI and machine-learning systems are doing on your site, in your auctions, with your traffic, across the last 7 to 30 days. Eight data windows, each tied to a real optimization that was already running in the background. The data is populated with your numbers the moment you open it without needing to download or configure anything yourself.
Why these eight areas
The things that move programmatic revenue in 2026 are not the same things that moved it in 2019. From cookie deprecation to AI Overviews reshaping how audiences arrive at sites. Per-impression pricing, first-party identity, contextual signals, viewability, and demand competition are the actual levers now.
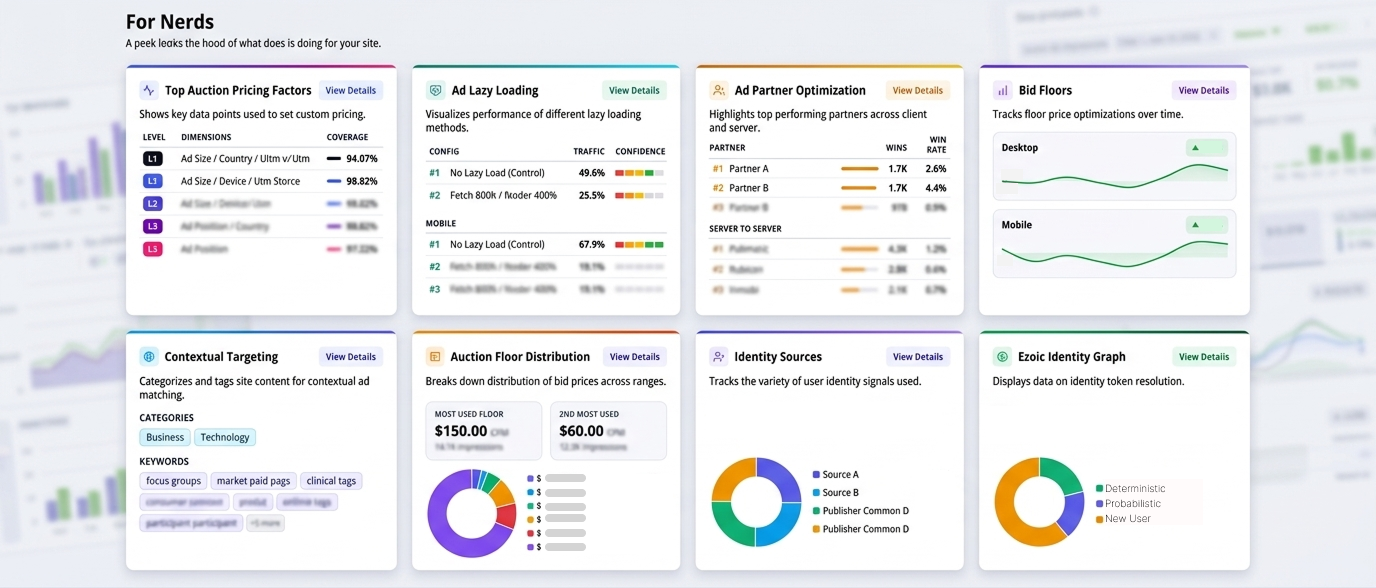
For Nerds maps directly onto those levers. Floor pricing is covered by three widgets: Top Auction Pricing Factors, Bid Floors, and Auction Floor Distribution. Identity is covered by Identity Sources and the Ezoic Identity Graph. Contextual signals live in the Contextual Targeting card. Viewability and load mechanics are in Ad Lazy Loading. Demand competition is Ad Partner Optimization.
Eight cards spanning across five revenue fronts. Each one is populated with the publisher’s own dataset so the experience is truly tailored to your site or app.
What the data actually shows
The widget most publishers stop at first is Auction Floor Distribution.
It shows the total count of distinct floor CPMs the AI used on your site over the last 7 days. For a typical site, that number is in the hundreds. For larger sites, it runs into the thousands. Thousands of distinct prices: not a single floor, not a handful of rules, but one price computed for each specific combination of user, device, content, geography, and market conditions. The detail view shows every individual floor value sorted by volume, so you can see exactly where your impressions are concentrated and at what price points.
Traditional floor pricing means setting one number, or a small table of rules. Every impression that goes out on the wrong floor is money left permanently on the table. You either undersold to an advertiser who would have paid more, or you priced yourself out of a bid that would have been filled. Ezoic computes a unique floor for every impression to avoid both failures. The distribution is the visual proof. One thing worth knowing before you read your Bid Floors chart: A declining floor line isn’t a bad sign. It means the AI is lowering floors to protect fill rate, and if RPM tracks with it over time, the system is working.
The identity widgets tell a different story: what Ezoic adds that a publisher couldn’t get alone.
Identity Sources lists every identity provider that resolved users on your site over the last 7 days with the coverage percentage each ID protocol and provider carries across your impressions. Rows marked with the Ezoic tag are tokens that exist on those impressions only because Ezoic’s identity infrastructure generated them. A publisher integrating one or two identity providers on their own is common. Ezoic runs dozens simultaneously, and the tagged rows are the direct, attributable value of that on your specific traffic.
The Ezoic Identity Graph takes it further. It shows how the cross-device system recognizes returning users across sessions, through deterministic matches (exact, privacy-safe signals) or probabilistic matches (ML on behavioral and environmental patterns), and what share of those identified users receive premium identity tokens in the auction as a result. Without the graph, a user visiting on their phone and later on their laptop looks like two separate unknown people. Advertisers bid low on unknown users. With it, both sessions unify into one profile and Ezoic injects premium tokens into the bid request.
Ad Lazy Loading is the least intuitive widget and one of the most consequential. The system continuously tests tens of thousands of configurations to find the optimal moment to load each off-screen ad: how far ahead of the viewport the creative starts downloading, how close it needs to be before it actually renders. Better-performing configurations get more of your traffic. A configuration at 2% traffic isn’t broken; it’s just being tested. The number worth watching is the rendered percentage, which shows the share of served ad slots where the creative actually loaded. A served ad that doesn’t render earns nothing.
How to use it
For Nerds is accessible from your main Ezoic dashboard. Each of the eight cards is a summary; each has a detailed drill-down with more granular data. Most cards cover 7 days on the summary view and extend to 30 days in the detail.
There’s no single right place to start. Publishers with high U.S. traffic tend to find the most signal in the identity widgets. Sites with diverse content verticals get a lot from Contextual Targeting, which shows RPM by IAB category and surfaces which parts of your content advertisers pay the most to reach. Publishers working through fill rate questions usually start with Ad Lazy Loading or Bid Floors.
The right widget depends on what your site is doing and what questions you have. That’s the design: eight data windows into the same underlying optimization, in any order, with your numbers.
What For Nerds is and what it isn’t
One thing worth being explicit about: For Nerds is a visibility product. The optimizations it exposes we’re already running. Opening the dashboard doesn’t change what the AI is doing; it lets you see what it was already doing.
The lift comes from the underlying systems, per-impression pricing, the identity graph, the lazy-loading optimizer, and the demand network. For Nerds is the window into those systems and a real look into why granularity and depth of our data is what makes us industry leaders. We’re a bunch of nerds at Ezoic. We thrive on data that drives real results for publishers, so sharing the For Nerds dashboard felt like a natural decision. If you’re curious to check it out, For Nerds is live in your Ezoic dashboard today.