Display Ad Rates By Geolocation In 2020…So Far

Get helpful updates in your inbox
We respect your privacy and will not share your email or crowd your inbox
Ezoic’s Ad Revenue Index, an interactive graph that shows relative online ad rates by day with an index of 100 being the highest date in recorded history, now has a new feature. If users submit their email address, they gain access to ad rates by geolocation.
At current, those who enter their email can see ad rates in the United States, United Kingdom, Germany, Canada, France, and India.
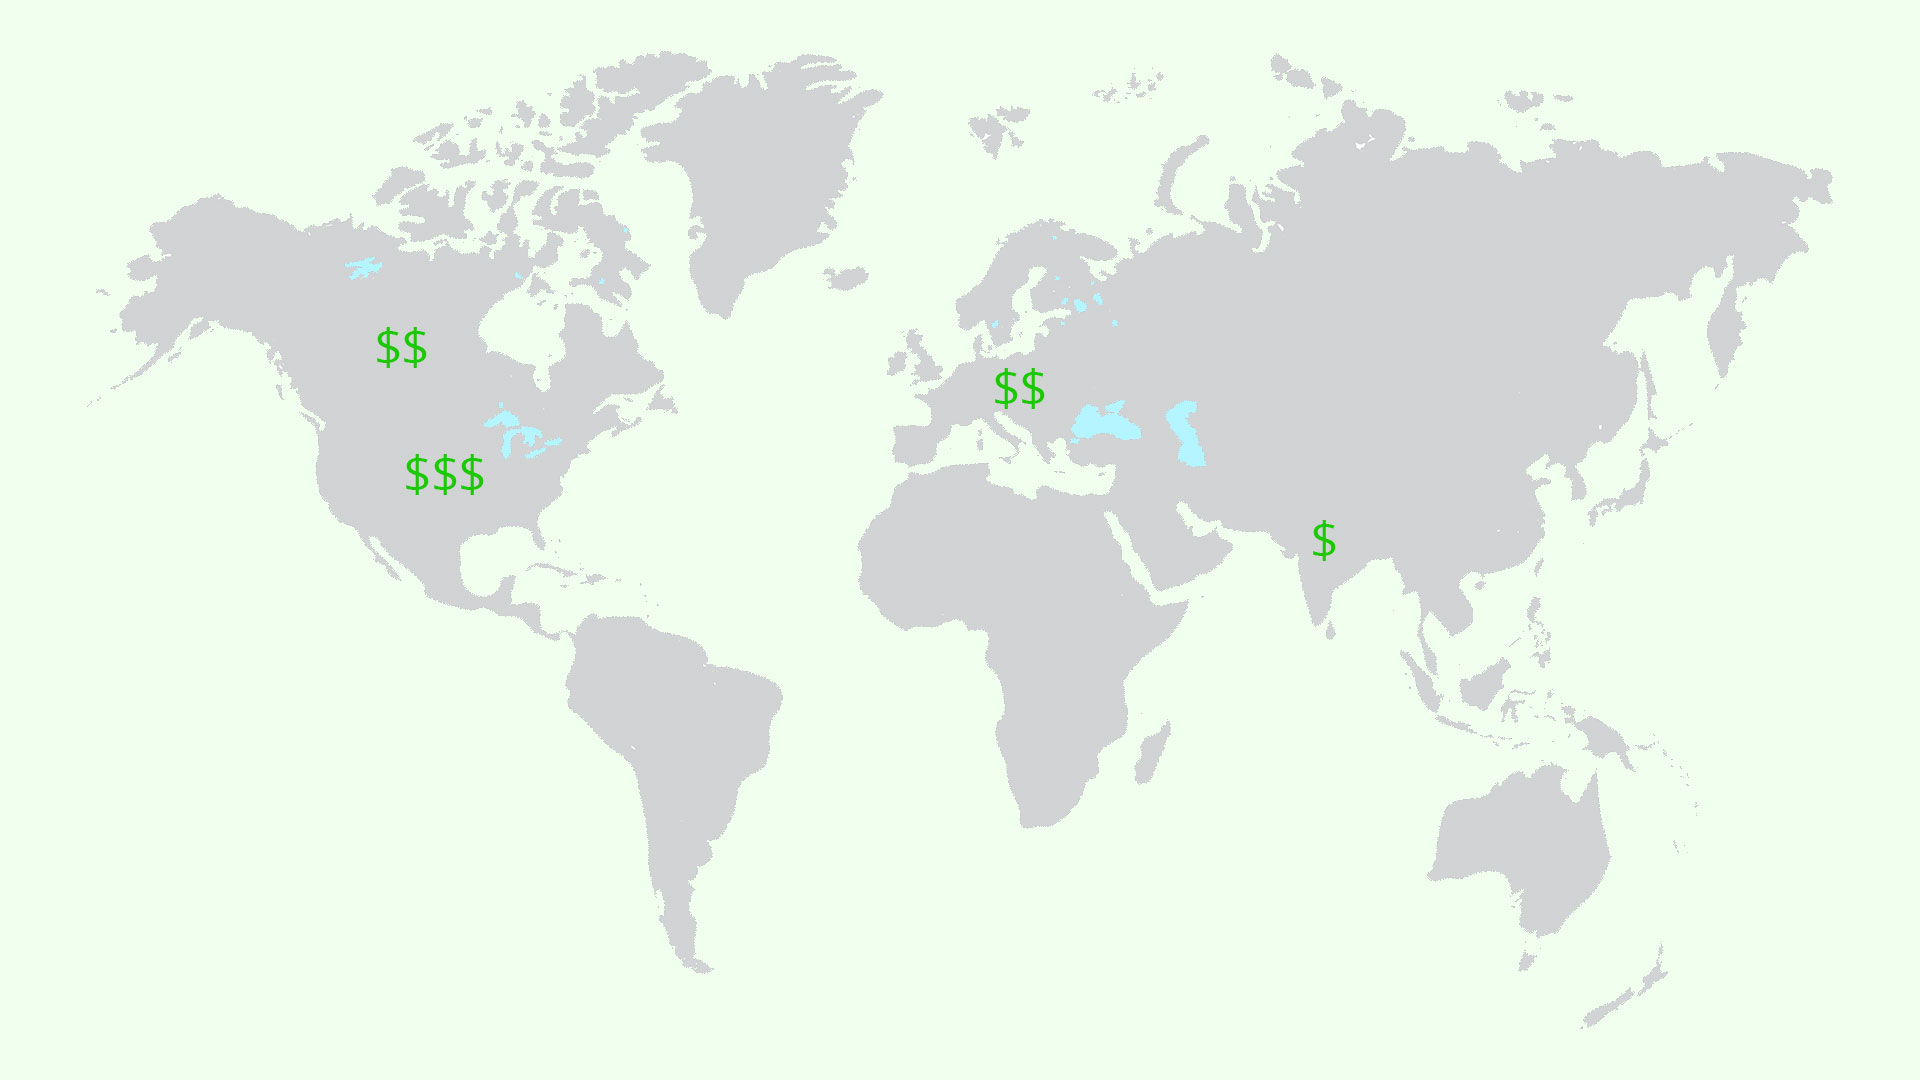
Today, I’m going to give you a quick breakdown of where ad rates are now compared to they were a year ago by geolocation.
Note: The Ad Revenue Index data by country are not comparable with one another in terms of money earned. Stated differently, an index of 75 for both India and the U.S. does not mean that the ad rate is the same in both countries. The data is relative on a country-by-country basis.
How Coronavirus affected display ad rates
When Coronavirus began to spread across North America, ad rates plummeted. There was a large amount of ad supply (available ad space on publisher’s websites) but very little demand from advertisers to serve ads. We’ve been covering how Coronavirus has been affecting ad rates since the beginning of the outbreak.
Below, you can see that starting around March, ad rates plummeted well below their Q1 and Q2 2019 levels. But at the end of Q2, around June, ad rates increase above the 2019 level for the same time period.
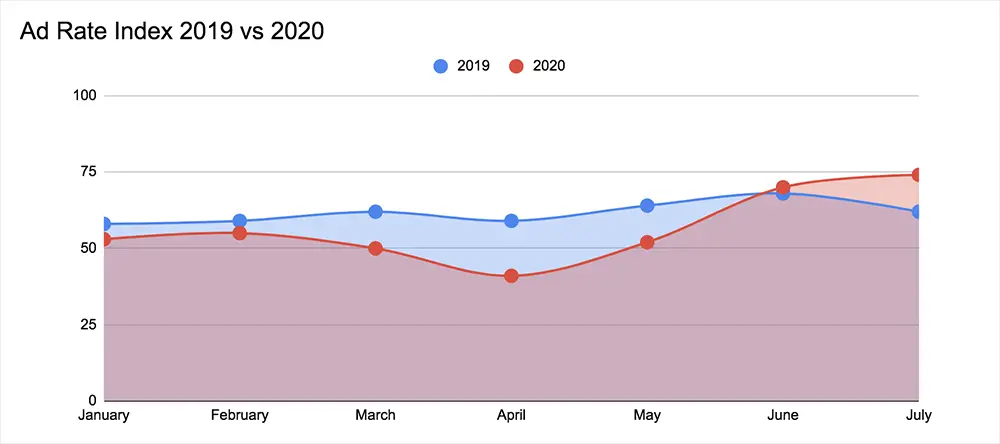
What’s important to note is that this dramatic surge in ad rates post-June has been primarily limited to the United States.
1. United States

July 22, 2020: 87
July 22, 2019: 58
In the United States, ad rates have been soaring over the past two months. At the same last year, the Ad Revenue Index was 58.
Without the pandemic, digital advertising would have grown by double digits. Ad Exchanger predicts that while total ad spend has declined, digital ad spend might be flatlined or see a 1% growth for the year’s total. Their findings tell publishers to expect a rebound in ad spend by Q3, with things returning closer (or above) normal levels by Q4.
The Ad Revenue Index for the United States mirrors this information. It’s great news for publishers with primarily U.S.-based audiences.
2. Germany
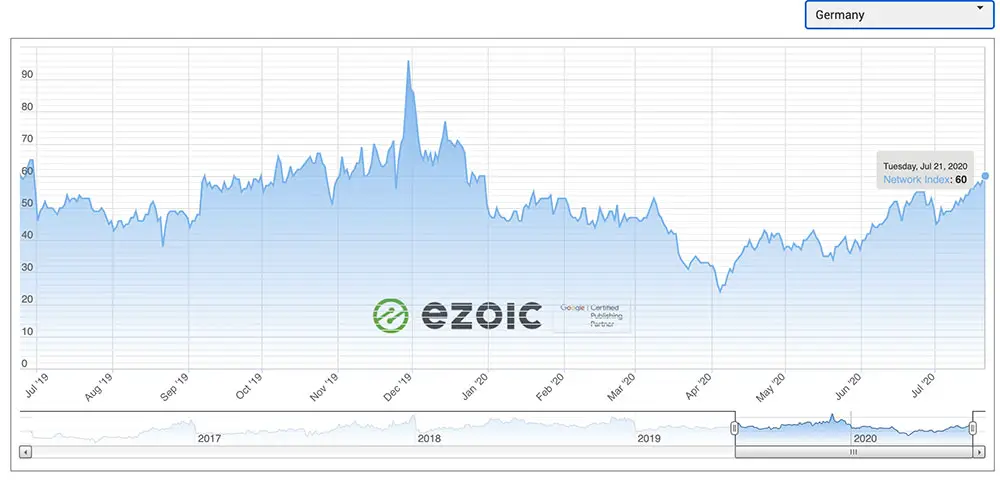
July 22, 2020: 60
July 22, 2019: 53
Outside of the U.S., Germany has faired the best in terms of ad rates. Germany is at a higher index number now than they were a year ago.
This might be due to the fact that many sources consider Germany’s handling of the Coronavirus a major success. According to this timeline, Germany’s lockdown efforts were visible by April 15th. By Mid-May, a nation of 83 million people was reporting less than 1,000 cases per day.
German advertisers are likely confident that COVID-19 doesn’t pose as big as a threat as it did originally.
3. Canada
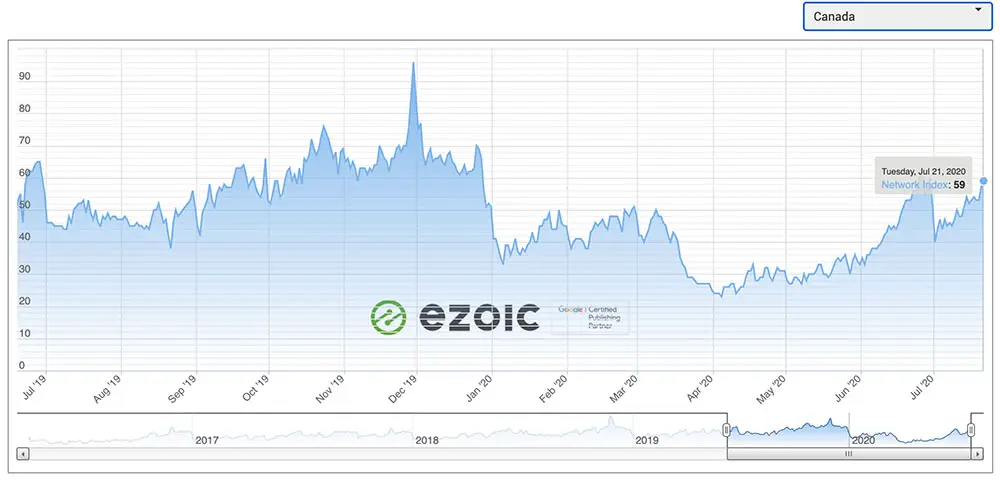
July 22, 2020: 59
July 22, 2019: 62
Canada’s ad rates are just 3 points lower than they were in 2019 on the same date. Compared to its neighbor to the south, Canada has had low numbers of the Coronavirus and has been heralded as a success in keeping numbers low.
This might be one of the factors as to why ad rates are more or less average for this time of year for Canada.
4. United Kingdom
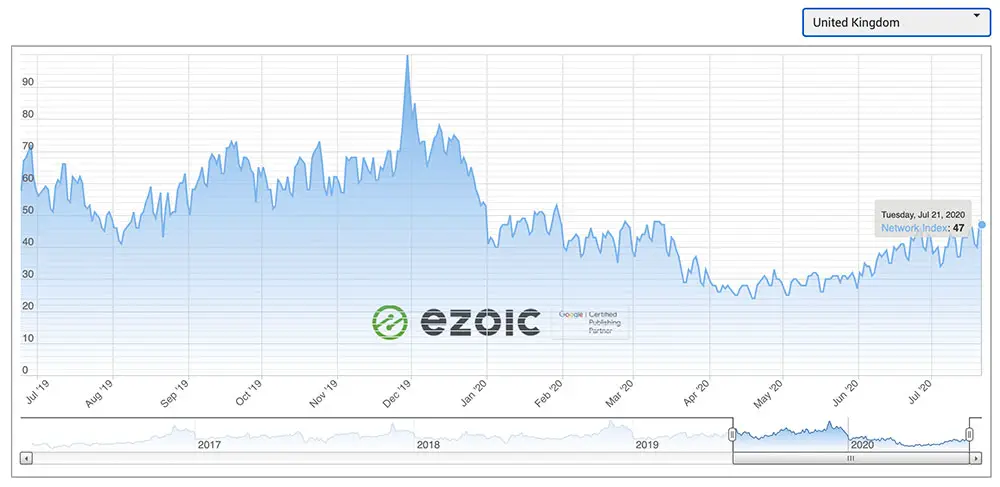
July 22, 2020: 47
July 22, 2019: 53
The United Kingdom is 5 points on the Ad Revenue Index lower than they were a year prior. But looking at the graph, it seems in July of 2019, there was a dip in ad rates. Then at the beginning of August 2019, the United Kingdom experienced a steady rise in ad rates until hitting its peak on Black Friday.
If this year’s ad rates follow the same pattern, we should see a steady increase in Q3 and into Q4 for the United Kingdom.
5. France
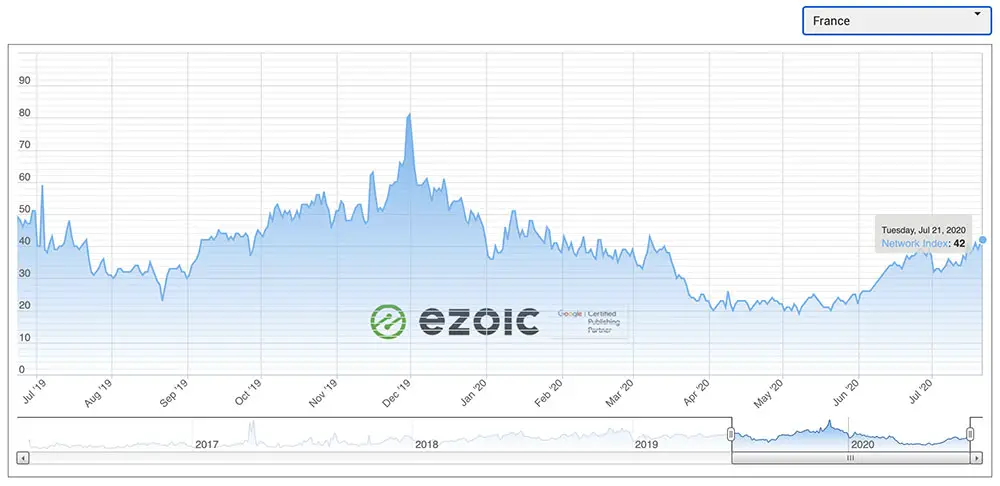
July 22, 2020: 42
July 22, 2019: 36
France’s position on the Ad Revenue Index is 6 points higher than it was on the same date in 2019. The graph shows a lull in July of 2019, and comparatively speaking, there seems to be a bit of linear growth since around May.
This comes as a welcome relief from April-May 2020 when the Index was registering consistently in the low 20s. These were the lowest numbers seen since February of 2018.
6. India
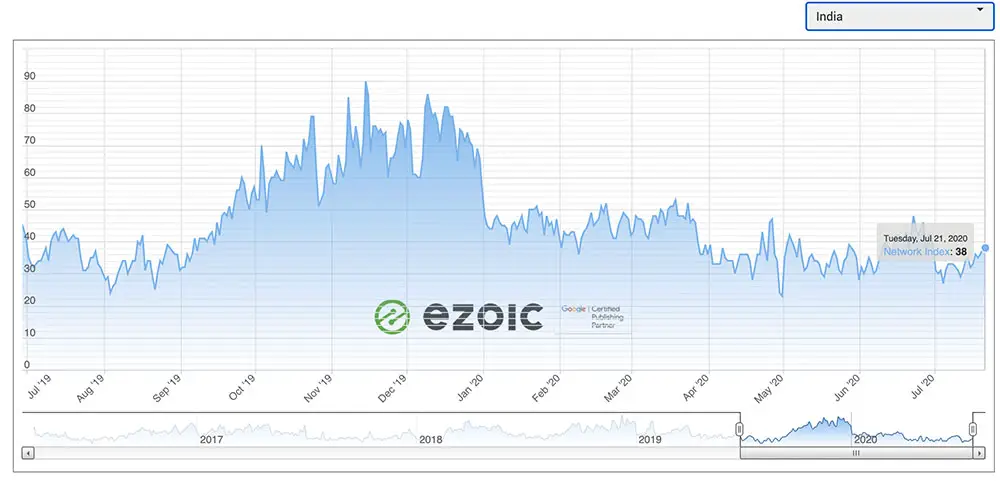
July 22, 2020: 38
July 22, 2019: 35
Publishers with Indian audiences have seen ad rates middling since after the New Year. Coronavirus hasn’t helped, and many publishers wonder how they are going to weather the storm.
The Index score for India is 38, which is actually 3 points higher than it was a year prior. We can see from the graph that around September 2019, the Index records a rather sharp growth until the rates hit their peak on Black Friday. Publishers can only hope that ad spend sees a similar uplift in the rest of Q3 and into Q4.
That being said, India is now 3rd in the world for Coronavirus infections. Researchers at the Massachusetts Institute of Technology predict that by the end of 2021, India will have the highest numbers in the world. These types of predictions might cause a lack of confidence from advertisers, and ad spend will suffer as a result.
Wrapping up display ad rates by geolocation so far in 2020
For now, it seems like the United States is ahead of the pack in terms of ad spend and increasing ad rates.
What’s happened throughout the pandemic is there’s a loss of ability to advertise in certain places we could before the pandemic. A great example is live sports. This loss then pushes things into the digital space, and digital begets digital. For example, eCommerce has grown drastically since the start of the pandemic.
While things seem to be slow to recover internationally, digital advertising budgets are easy to crank up. We’ve seen that increase in the United States, but it might take some time to bounce back elsewhere.
Allen is a published author and accomplished digital marketer. The author of two separate novels, Allen is a developing marketer with a deep understanding of the online publishing landscape. Allen currently serves as Ezoic's head of content and works directly with publishers and industry partners to bring emerging news and stories to Ezoic publishers.
Featured Content
Checkout this popular and trending content

Ranking In Universal Search Results: Video Is The Secret
See how Flickify can become the ultimate SEO hack for sites missing out on rankings because of a lack of video.
Announcement
Ezoic Edge: The Fastest Way To Load Pages. Period.
Ezoic announces an industry-first edge content delivery network for websites and creators; bringing the fastest pages on the web to Ezoic publishers.
Launch
Ezoic Unveils New Enterprise Program: Empowering Creators to Scale and Succeed
Ezoic recently announced a higher level designed for publishers that have reached that ultimate stage of growth. See what it means for Ezoic users.
Announcement